
The $3 Test Failed and the Calendar Is Taking Over
October natural gas ran at $3 Wednesday and got rejected. The contract hit $2.978, could not hold it and settled back at $2.891. That close below the session high looks like longs getting out, not new buyers coming in.
Late-summer heat and a lean storage estimate were enough to force prices higher early in the session. They were not enough to keep the bid alive once the market saw what was on the other side of September.
The six-to-15-day forecast is cooler and power-sector demand is set to drop roughly 6.1 Bcf per day before the month ends. The bulls got their shot at $3. They did not convert.
At 09:30 GMT Thursday, October Natural Gas futures are trading $2.898, up $0.007 or +0.24%.

The Heat Is Real but September Is Running Out of Days
The southern two-thirds of the country is sitting in the 80s to 100s through the weekend. Commodity Weather Group expects above-average temperatures across the South and Southeast through September 25. Air conditioners are still running. Power plants are still pulling gas. Edison Electric Institute data backs it up with lower-48 electricity output up 16.1% from a year ago in the week ended September 12 at 94,427 GWh.
That demand is real and it has been keeping the floor under this market all week. The problem is what the models show after September 25. Cooler conditions across the South with the northern half of the country in the 60s to 80s. That is a light-demand pattern. Power-sector gas burn is expected to drop 6.1 Bcf per day between now and the end of the month. The bulls had late-summer heat working for them and the calendar is about to take it away. October expiration is approaching and buyers need $3.026 before the weather story fades.
Natural Gas Price Forecast
Every new Natural Gas analysis as it publishes, today's technical signal and key levels, live price — on one page.
See all Natural Gas forecastsThursday’s Storage Report Is Not Going to Break the Argument
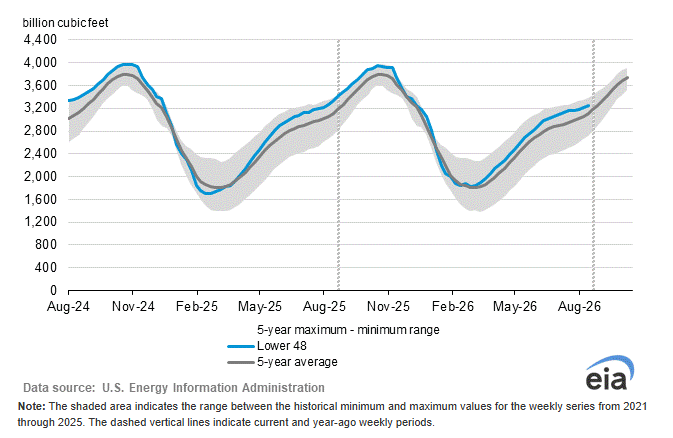
The consensus estimate calls for a 48 Bcf injection for the week ended September 11. The Wall Street Journal survey has it at 49 Bcf. Both are well below the five-year average build of 74 Bcf. A lean number trims the surplus. It does not erase it.
Last week’s EIA report showed a 40 Bcf injection against a 34 Bcf estimate. Stocks as of that report were down 2.7% from a year ago but still 4.8% above the five-year seasonal average.
The EIA projects inventories hitting 3,985 Bcf by the end of October, the highest end-of-October level in 10 years. That projection sits over the market and it means one below-normal build is not going to change the conversation. The bulls need a string of them. They are getting one report at a time and production is not cooperating.
Production Is Still Winning
Lower-48 dry gas output hit 112.3 Bcf per day Wednesday, up 4.0% from a year ago according to BNEF. Demand came in at 76.3 Bcf per day, up 2.4% year-over-year. Demand is improving. Production is improving faster. That gap is why rallies keep stalling before they can build real momentum.
Baker Hughes added two gas rigs last week bringing the count to 132, just below the three-year high of 134 from February. More rigs means more supply in the pipeline over the coming months. The EIA also raised its 2027 dry-gas production forecast to 116.0 Bcf per day. The production story is not getting smaller. It is getting bigger and every rig added makes the bull case harder to sustain without a weather event or a storage surprise.
The European Bid Faded at the Wrong Time
U.S. LNG exports slipped to 18.5 Bcf per day Wednesday, down 4.7% from the prior week. European gas prices pulled back to a one-week low after hitting a 3.75-year high Monday. European storage sat at 68% full as of September 14 against a five-year average of 85%. The winter shortage story is still alive over there. But European prices retreated at the same time October natural gas was testing $3 and that removed the overseas support that had been helping the bid earlier in the week.
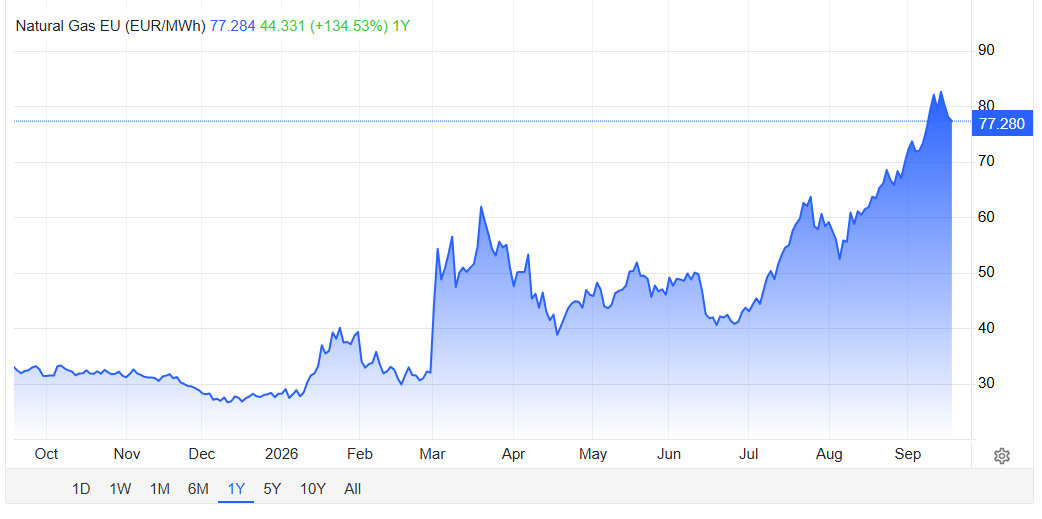
The European story is bullish on a monthly timeframe. On a daily basis, the TTF pullback took away the one outside catalyst that could have pushed October gas through $3. The Gulf Coast export pull needs European prices to stay elevated. If TTF stabilizes or turns higher again, the LNG bid comes back. Wednesday it was not there when the market needed it most.
Daily October Natural Gas Technical Analysis
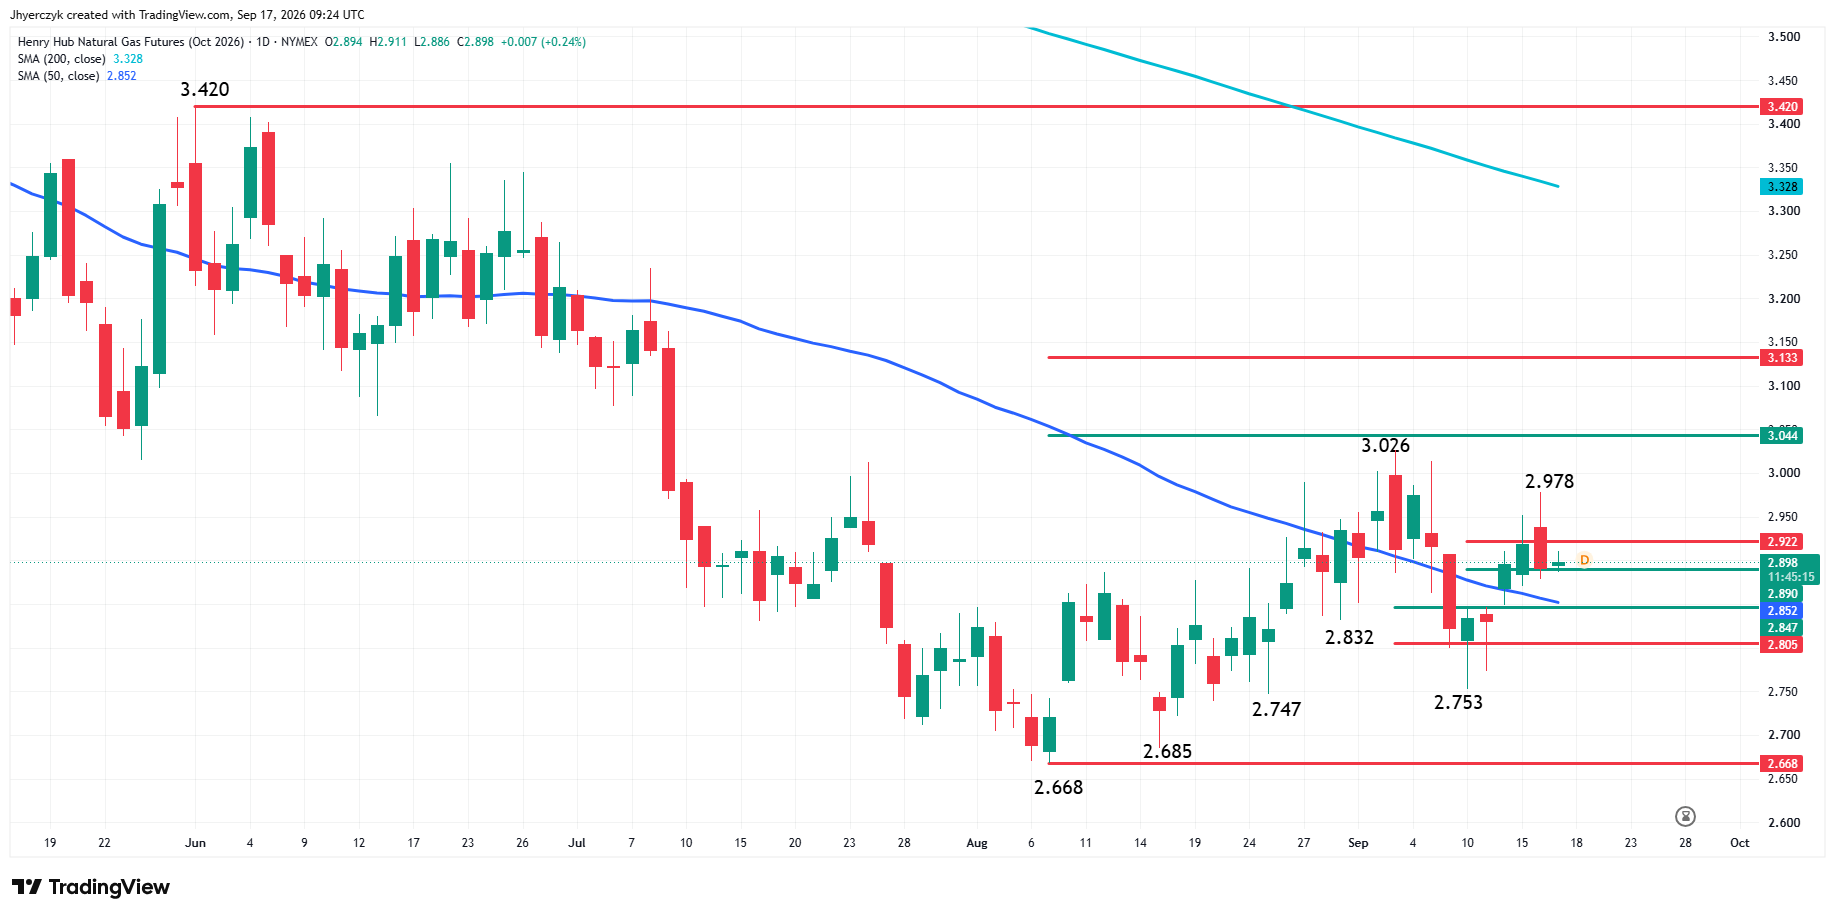
October natural gas futures are inching higher early Thursday after posting a minor reversal top at $2.978 during the previous session. The main trend is down according to the daily swing chart. A trade through $3.026 will change the main trend to up. A move through $2.753 will reaffirm the downtrend.
The market has been trading on the strong side of the 50-day moving average at $2.852 for four sessions.
The short-term range is $2.668 to $3.026. Its retracement zone is $2.847 to $2.805. On September 10, sellers took out this zone, driving the market to $2.753. Since then, October natural gas has clawed back losses to $2.978.
The minor range is $3.026 to $2.753. On Wednesday, October natural gas pierced its retracement zone at $2.890 to $2.922 before hitting an intraday high of $2.978. The market is currently trading inside this zone.
What to Watch
Thursday’s EIA report is the immediate test. A build near 48 Bcf keeps the storage trend constructive. Anything above the five-year average build of 74 Bcf would hand sellers back the argument and push the focus to production. Weather models Tuesday and Wednesday next week determine whether the cooler six-to-15-day outlook holds or gets revised warmer. A hotter revision forces another attempt at $3. A cooler confirmation tells the market that Wednesday’s spike was the last summer trade.
The bias leans bearish with the main trend down on the daily swing chart and Wednesday’s reversal top at $2.978 reinforcing the resistance. The 50-day moving average at $2.852 has been supporting the market for four sessions and that sustained hold is weakening the bearish case even with the trend pointing down. October expiration is approaching and that compresses the timeframe.
Buyers need to clear $2.978 and then $3.026 quickly to change the trend. Sellers need the 50-day to break. A move through $2.753 reaffirms the downtrend and tells the market that the higher bottom from last week did not hold.
More Information in our Economic Calendar.