A Critical Test at $2.81
Natural gas rallied sharply on Monday to test key initial resistance levels, reaching a high near $2.81, which matches the recent lower swing high generated last week. Buyers remain in control at the time of writing, with trading continuing near the highs of the day. Two basic scenarios look likely. Either resistance will be strong enough to turn price back down toward last week’s trend low near $2.62, retaining the short-term downtrend, or strength continues above key levels indicating a reversal of the short-term downtrend structure.
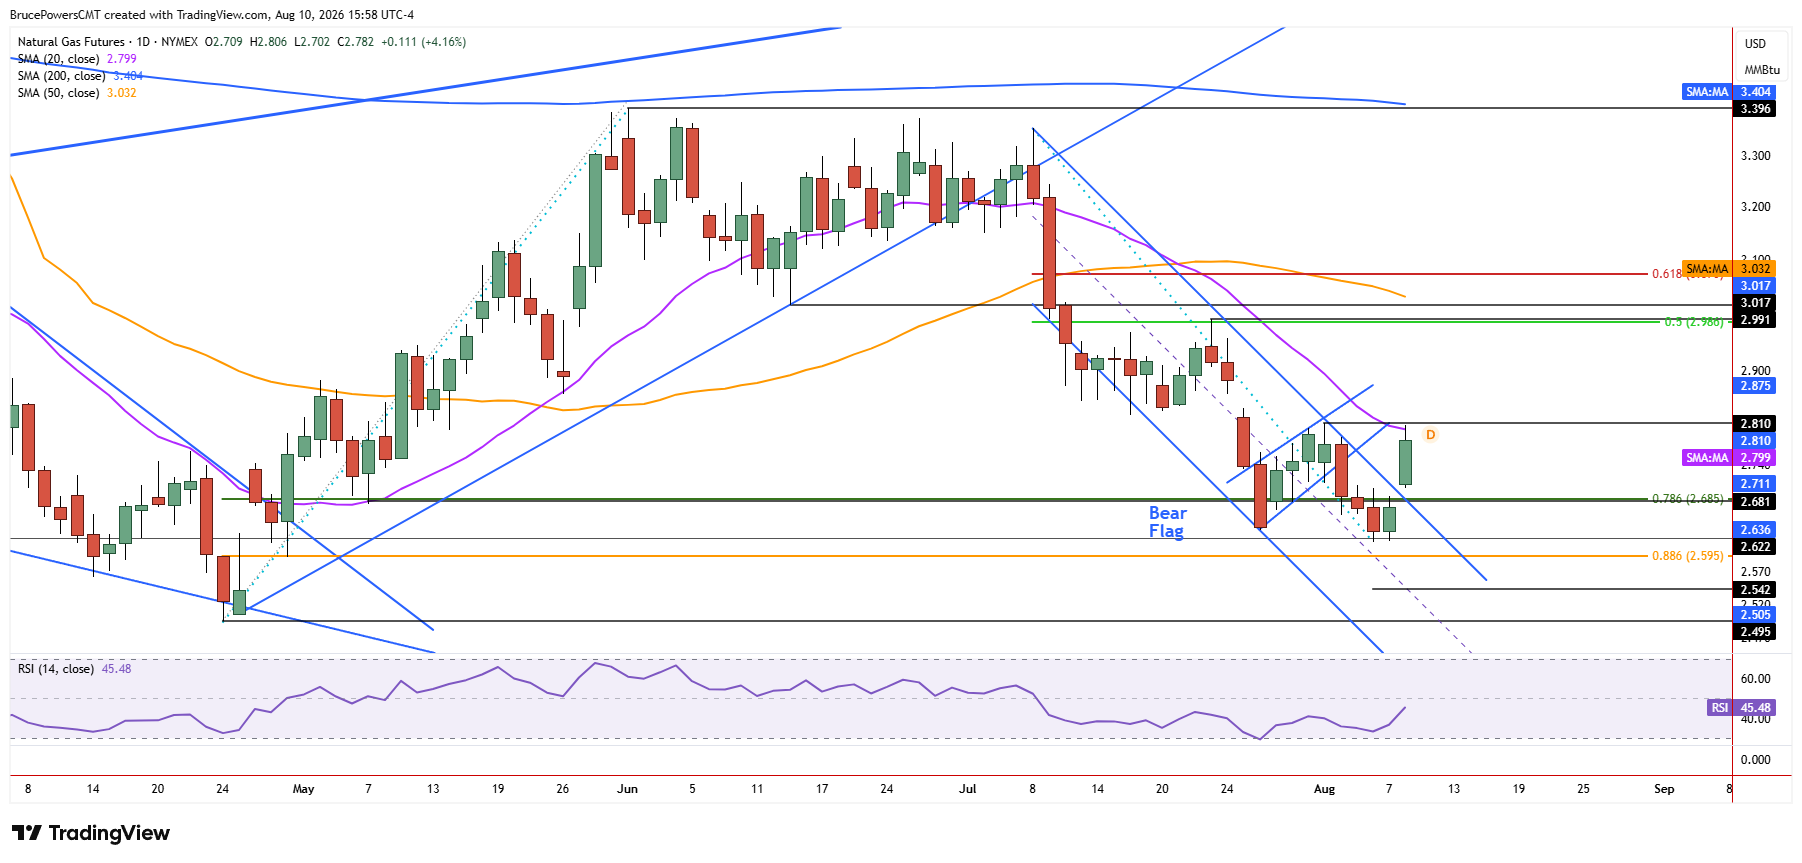
In addition to a test of resistance at the recent lower swing high, the 20-day moving average was also successfully tested, now near $2.80. Monday’s advance marked the first pullback to test that indicator as resistance following a break below it in early July. Therefore, the short-term bearish trend would remain dominant unless there is a decisive rally above $2.81. That would also confirm a reclaim of the 20-day moving average, providing two concurrent bullish signals

Bearish Flag Faces Failure Risk
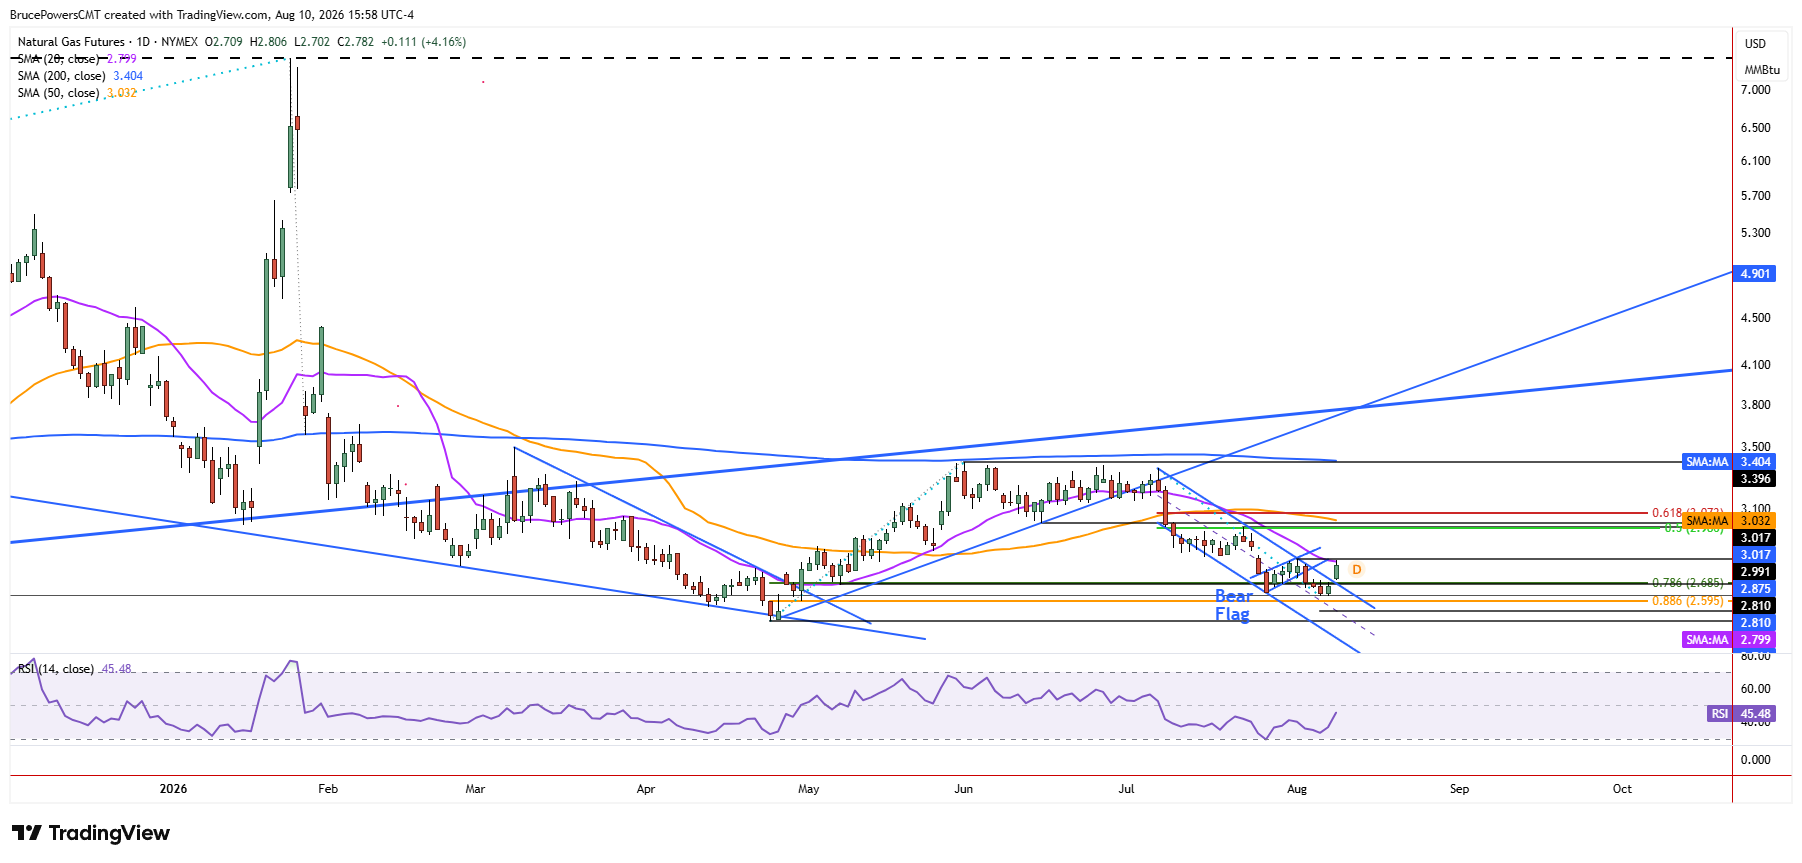
Although Monday’s upside pullback showed strong momentum it was also the first pullback after a bearish trigger for a falling flag pattern last week. That bearish trigger led to the new trend low and suggests lower downside targets are possible. The bearish flag remains valid unless an upside breakout above $2.81 triggers. Such a breakout would invalidate the pattern’s further downside potential. Monday’s pullback therefore keeps the possibility of continued resistance open, leaving the flag valid but at increasing risk of failure.
A Breakout Opens the Door to $3.03
If $2.81 is decisively reclaimed, the resulting bullish reversal signal would shift attention to the next higher resistance zone at $2.99 to $3.02. There is also the falling 50-day moving average at $3.03 that becomes an additional upside target once the 20-day moving average is reclaimed. That indicator broke sharply to the downside on July 9 and there has not yet been a notable pullback to test it as resistance.
Its potential significance increases as price approaches it from below, particularly if the $2.81 breakout is confirmed. This makes the $2.81 resistance test an important near-term pivot. If price is rejected the bearish structure is preserved, while a decisive breakout would open the way toward the $2.99 to $3.03 resistance zone.
If you’d like to know more about how to trade natural gas, please visit our educational area.