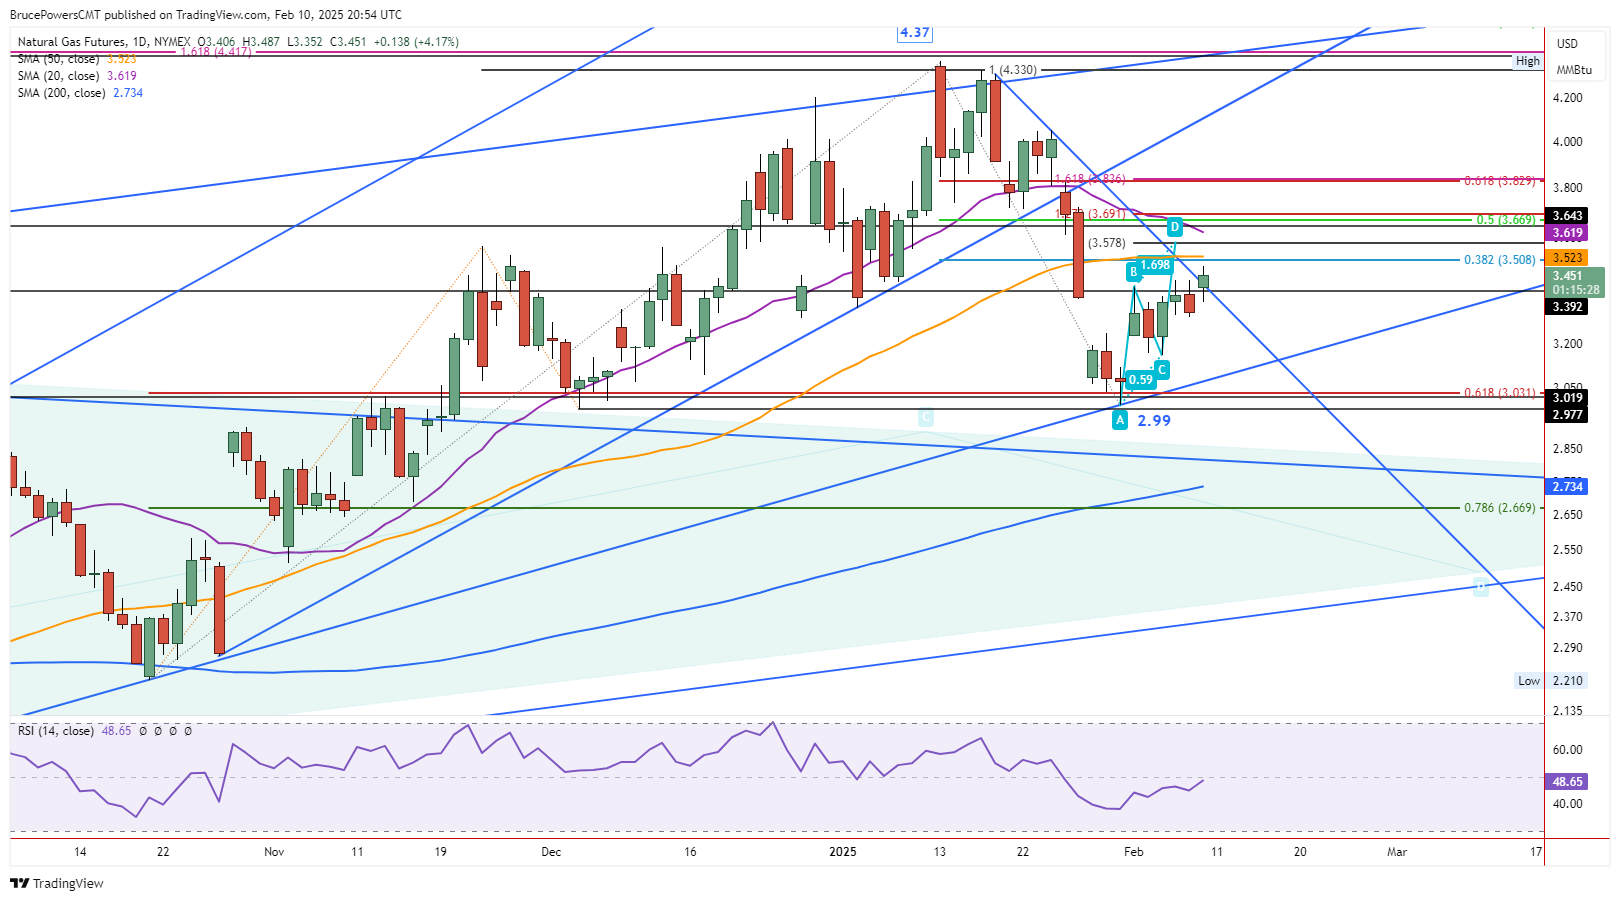
Natural gas continued to rise towards the 50-Day MA on Monday with a new high for the short-term advance at $3.49. That high was a little shy of the 38.2% Fibonacci retracement at $3.51 and the 50-Day MA at $3.52. They loom a little higher and may yet be an area of resistance on the way up. A touch of the 50-Day line would be the first test of line as resistance since it failed as support on January 28. The first touch of a prior support line as resistance commonly shows signs of resistance. Also, a decisive breakout through the pivot would be a sign of strength.

On Track to Close Strong
At the time of this writing, natural gas was trading in the top third of the day’s trading range and looks likely to close the day in a similar way. A daily close today above last week’s high of $3.44 would provide an additional sign of strength for the developing uptrend. Moreover, today’s advance triggered a breakout above a falling trendline, and the closing price will likely be above it, which would be a sign of strength.
Possibly, upward momentum can stay strong enough for the 50-Day line to be reclaimed and then further exceeded. There is a rising ABCD pattern (light blue) on the chart with an initial target at $3.58. It provides the possibility of this. Nonetheless, it is higher target whether approached on a breakout through the 50-Day line or following a bearish pullback.
Heading Towards Top of Range?
Another item that is supportive of a continuation higher is the wide range engulfing candle pattern on the weekly chart (not shown) with a range of $2.99 to $3.83. Rather than engulfing the prior price action, this candle overrides subsequent price action. Last week’s trading range was within the price range of the week before. And this week’s price range could easily do the same.
Last week’s wide range could provide an environment like trading inside consolidation. Once support is tested at the bottom of a range, which happened with the swing low and weekly low at $2.99, a swing back in the other direction, in this case up. A decisive breakout above the 50-Day MA would provide the next sign of strength and possible continuation of the advance.
Natural Gas Price Forecast
Every new Natural Gas analysis as it publishes, today's technical signal and key levels, live price — on one page.
See all Natural Gas forecastsFor a look at all of today’s economic events, check out our economic calendar.