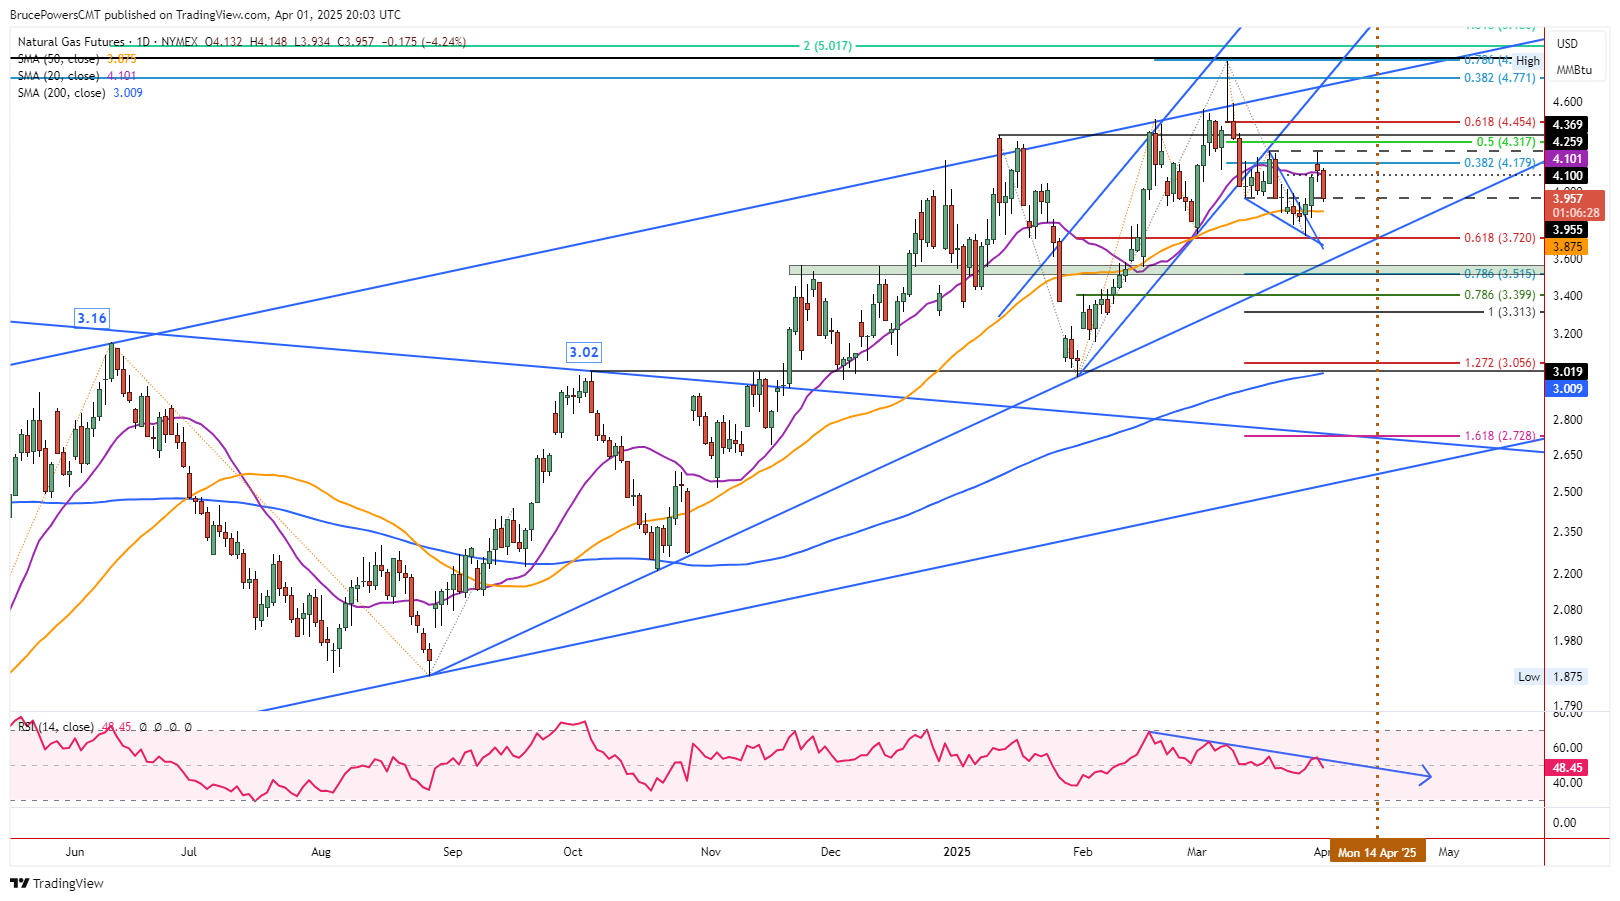
It looks like a test of support around the 50-Day MA may be in the plans for natural gas. On Tuesday, natural gas dropped below Monday’s low of $4.25 and back below the 20-Day MA. Sellers remain in charge at the time of this writing, as trading continues near the lows of the day, now at $3.93. Potential short-term support at the prior interim swing low of $4.26 seems to be holding so far, but solid selling seems destined to lead to a test of the support near a bull wedge breakout level and the 50-Day MA, now at $3.88.

Normal Pullback Expected
A bull breakout of a descending wedge trend continuation pattern triggered last Thursday and led to a rally into resistance at Monday’s high of $4.25. The current pullback is typical following a breakout as prior resistance areas are tested as support. Once support is found there is the potential for another advance. The weekly chart is also supportive of such a scenario.
On Monday a bullish weekly reversal triggered above last week’s high of $4.10, following a two-week pullback. Although it quickly failed there is the potential for this week to end with a higher weekly high and higher weekly low. Therefore, traders and investors will likely be watching the current bearish pullback for signs of support that may lead to a bullish reversal.
50-Day Moving Average Support
Notice that the 50-Day MA was clearly a support area during the early-March swing low. During the recent correction it was undercut for a couple days and then reclaimed relatively quickly. Therefore, during this decline natural gas could dip below the 50-Day line briefly but should recover quickly. If it does not and there is a daily close below the moving average, then the risk of further downside increases.
Trendline Support Dynamics
Since the higher trendline support was broken mid-March, there is the possibility of eventually testing the next lower trendline before a bearish correction is complete. Since the line is rising it will represent a price above the recent corrective low of $3.73 around April 14 (vertical). Given the overall pattern and potential support around the 50-Day line, there is the possibility of seeing consolidation until then between the recent low and this week’s high.
Natural Gas Price Forecast
Every new Natural Gas analysis as it publishes, today's technical signal and key levels, live price — on one page.
See all Natural Gas forecastsThe next lower trendline has three points thereby marking it as a solid line. Therefore, it should act as support the first time it is approached, or a break below could lead to a sharp drop given the potential significance of the trendline.
For a look at all of today’s economic events, check out our economic calendar.