


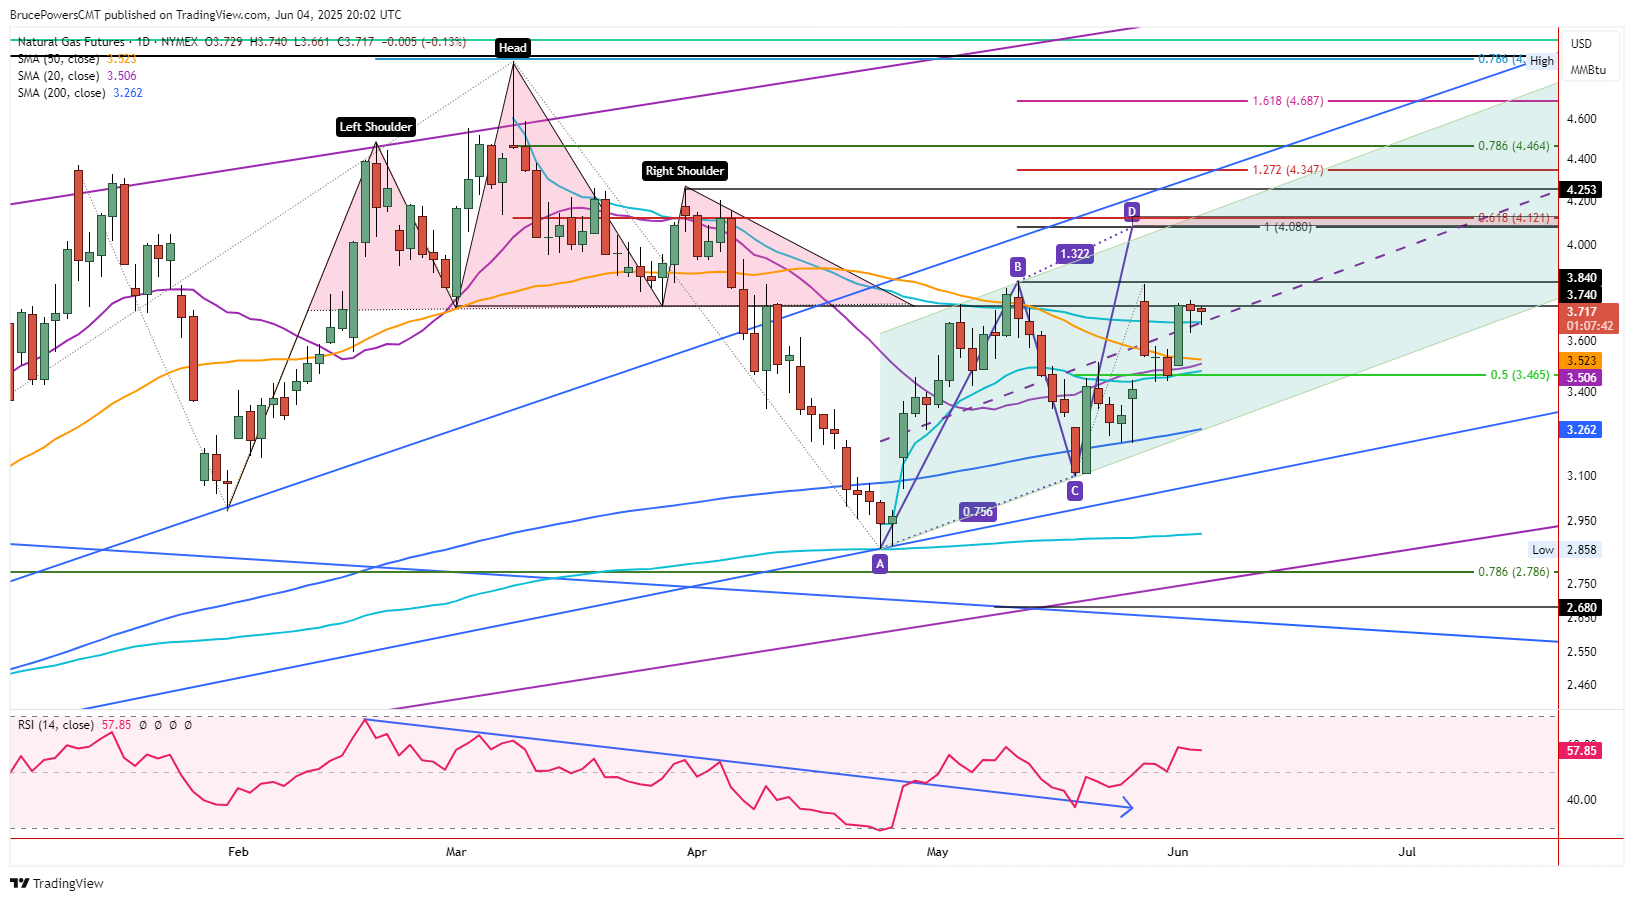
Although there was not much movement in the price of natural gas on Wednesday, it did retain signs of strength. Natural gas is on track to end the day with a narrow inside day, and it follows a narrow range day from Tuesday. The range for each day is in the top half of Monday’s trading range, which is a sign of strength. Moreover, resistance for the past few days was seen around the neckline of a head and shoulders top formation that triggered in early April at $3.73. So, a reclaim of that price level with a daily close above it would be bullish.

Challenging Key Resistance
Notice that there has been only one day since the April bottom that natural gas closed above the neckline, indicating a potential bullish breakout. The current and second test of the neckline may have greater success. Nonetheless, the recent swing high at $3.84 (B) is a key pivot that needs to be reclaimed before higher targets are valid.
Signs of Strength
At the time of this writing, the high of the day was $3.73 and the low $3.66. Notice that support for today and yesterday was found around two lines. There is a dashed line that marks the halfway point of a rising trend channel (green) and an AVWAP support line (light blue) begun from the trend high in March.
A successful test of support around those lines the past two days is a sign of strength as the lines previously represented dynamic resistance. It is also interesting to note that the weekly 20-period moving average has been converging recently with the AVWAP. Currently, they each mark a similar support level.
ABCD Pattern Triggers Above $3.84
A rise above today’s high will trigger a breakout of an inside day, while an advance above yesterday’s high of $3.76 provides a stronger bullish signal. If momentum is retained that should lead to a breakout above the $3.84 swing high and trigger a continuation of a rising ABCD pattern. An initial target from that pattern is at $4.08. But it is joined by the 61.8% Fibonacci retracement at $4.12. They should be looked at as a potential resistance area.
Natural Gas Price Forecast
Every new Natural Gas analysis as it publishes, today's technical signal and key levels, live price — on one page.
See all Natural Gas forecastsFor a look at all of today’s economic events, check out our economic calendar.



