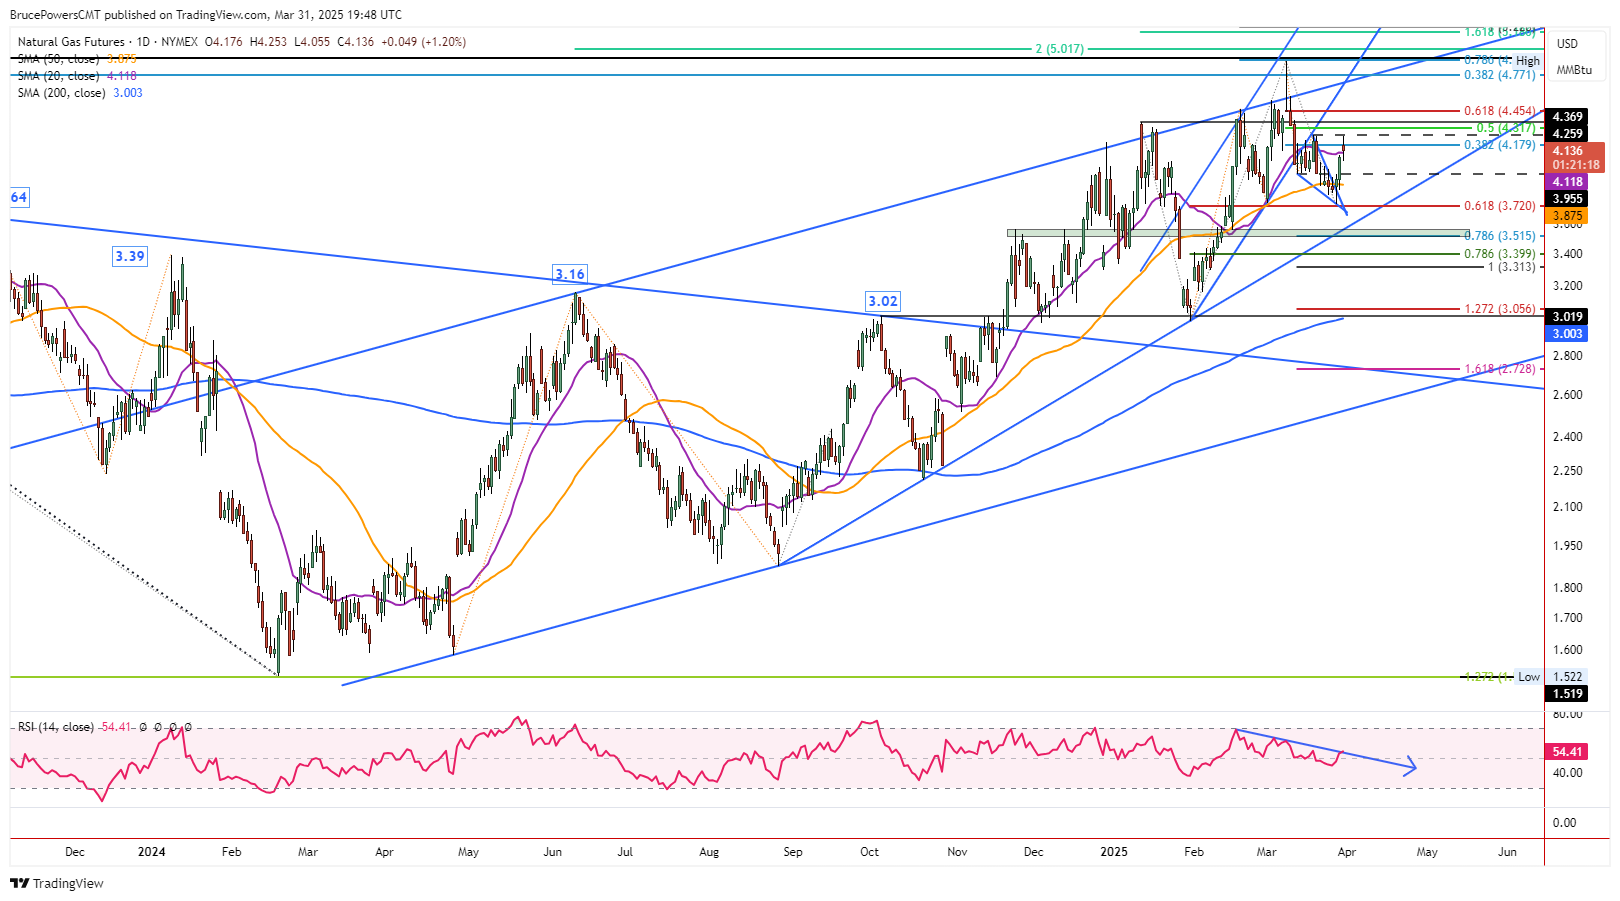
Natural gas continued its advance on Monday to a high of $4.25 before encountering resistance and pulling back intraday. Given the subsequent bearish response, that high was a successful test of resistance at the recent lower swing high of $4.26. Earlier in the trading session the 20-Day MA, now at $4.12, was reclaimed and a 38.2% Fibonacci retracement was completed at $4.18. Although a rise above those two price levels is a sign of strength, the subsequent decline from the day’s high is a sign of weakening bullish momentum.
Natural Gas Price Forecast
Every new Natural Gas analysis as it publishes, today's technical signal and key levels, live price — on one page.
See all Natural Gas forecastsMoreover, at the time of this writing natural gas continues to trade in the lower half of the day’s trading range. An additional sign of weakness will occur if Monday ends in the lower half of the range, which would be below $4.15. Also, the day’s closing price, relative to the 20-Day MA, may provide a clue as to whether a reclaim of the 20-Day line is confirmed.

Potential Higher Target
An initial target from the bull wedge is the beginning of the wedge at $4.26. That target was essentially satisfied today. Nonetheless, that doesn’t mean the advance is over, but maybe natural gas takes a rest first via a pullback or consolidation before attempting higher prices. Also, when adding the height in price to the breakout level, an alternative potential target of $4.40 is established. As with all targets they are estimates that may or may not be reached.
Drop Below $4.06 Points to a Likely Pullback
A decline below Monday’s low of $4.055 is a sign of further short-term weakening that could lead to a move lower to test prior resistance areas as support. Two initial price areas to watch for signs of support include prior support from the mid-March interim swing low at $3.96, and the 50-Day MA, now at $3.87. It is interesting to note that the breakout of the top line of the wedge occurred at a similar price area.
Following the reclaim of the 50-Day MA on February 13, the 50-Day line successfully tested as support in early-March and a higher swing low was established. Although the recent decline failed to find support at the 50-Day MA, the subsequent quick bullish recovery can be viewed as a successful test of support at the 50-Day line.
For a look at all of today’s economic events, check out our economic calendar.