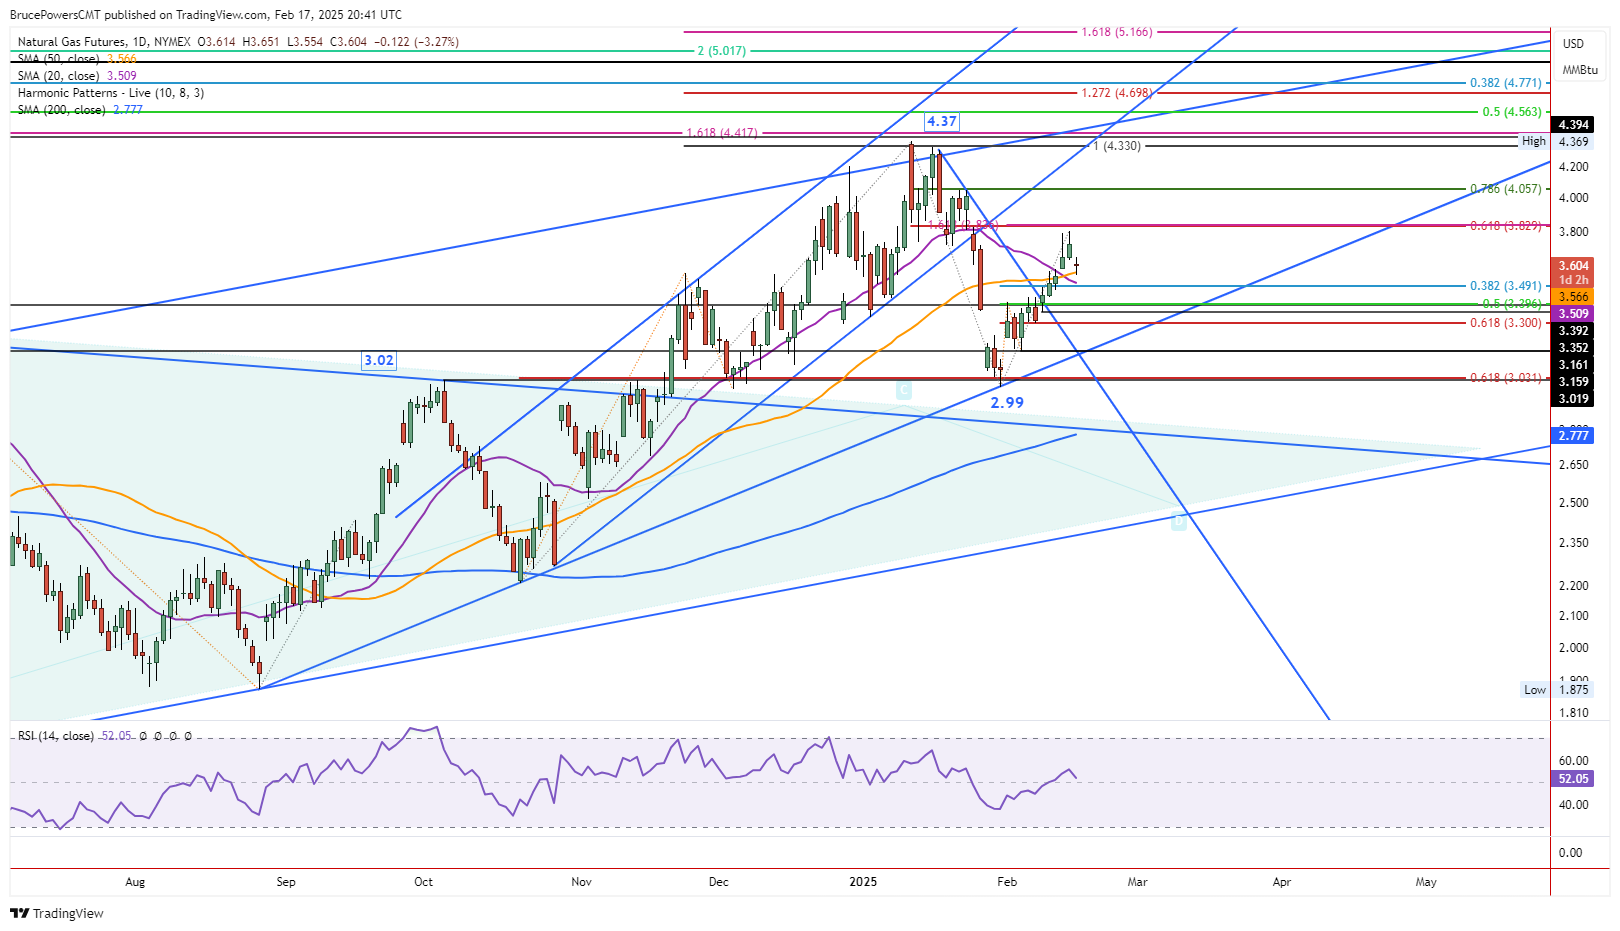
Natural gas pulled back on Monday from a rally high of $3.80 that was reached on Friday. During the recent advance natural gas showed strength by reclaiming both the 50-Day and 20-Day MAs and closing above each. Resistance at last week’s high was a little shy of the 61.8% Fibonacci retracement level, which is $3.83.
There is also a prior weekly high at $3.83 that further confirms the potential resistance zone. The question now is whether strength will be retained within a relatively minor pullback or consolidation, or whether a bearish correction will be deeper, before the bull trend may be ready to continue.

Moving Averages Provide Key Near-term Price Levels
Today’s pullback found support at a low of $3.55. That was a successful test of support around the 50-Day MA, currently at $3.57. A little lower is a range from $3.51 to $4.49, which combines the 20-Day MA at $3.51 and the 38.2% Fibonacci retracement level at $4.49. It provides the first more significant support level and is the minimum expected retracement from Fibonacci analysis.
That would be the first price zone where the possibility of a bullish reversal improves. Although it is only one day, the fact that support was seen around the 50-Day line is a bullish sign and it shows the market recognizing the level.
Deeper Pullback Likely if Moving Averages Fail
Nonetheless, a deeper pullback to test the lower support level would not be a surprise. The rally from the $2.99 low in December showed underlying strength as natural gas had gained $0.81 or 27.0% as of last week’s high. Strength was retained through much of the advance as evidenced by only one relatively minor pullback represented by a lower daily low. And the bigger picture in natural gas remains bullish as the uptrend price structure has not been violated.
The near-term uptrend adjusted the angle of ascent to align with the uptrend line that starts from the swing low from August 2024. Notice that the line was confirmed as support with the recent swing low of $2.99. That swing low provided a third touch of the trendline. Clearly, support was seen from that low as it led to a bullish reversal and rally.
Natural Gas Price Forecast
Every new Natural Gas analysis as it publishes, today's technical signal and key levels, live price — on one page.
See all Natural Gas forecastsFor a look at all of today’s economic events, check out our economic calendar.