


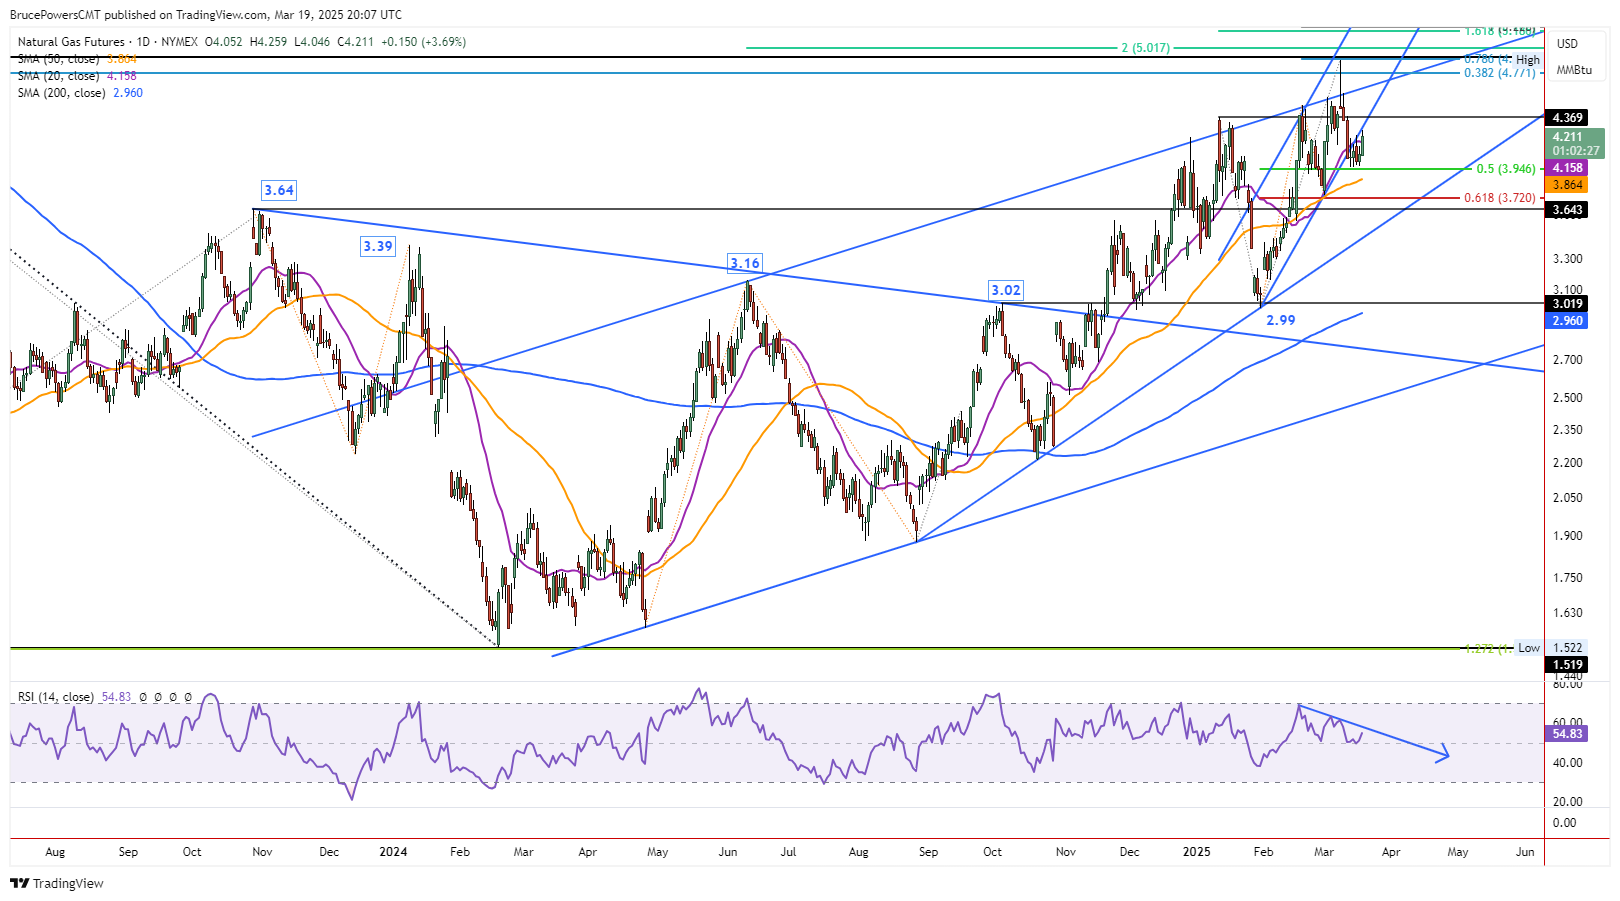
Natural gas strengthened on Wednesday and reached a five-day high of $4.25. The high for the day was a successful test of resistance around a trendline. Following a breakdown from the trendline last week natural gas consolidated in a relatively narrow four-day price range, largely below the trendline and the 20-Day MA. The 20-Day line also failed as support last week.
Trading continues near the highs of the day at the time of this writing and natural gas may close within the top quarter of the day’s trading range. That would be a bullish close. Also, today looks likely to end with the first daily close above the 20-Day MA in six days.

Trendline Resistance
Nonetheless, the rising trendline may continue to mark resistance on the way up and therefore hampers the potential of a rally. It is also important to note that this week’s price action is contained within the price range from last week. Last week’s high of $4.90 established a new high for the uptrend, but it was followed by sellers taking control. Subsequently, the week ended with a bearish looking relatively wide range candlestick pattern. Since sellers dominated price action last week, downward pressure may continue.
Potential for Falling ABCD Pattern
Therefore, it looks like a rally may establish a lower swing low and the CD leg of a declining ABCD pattern. The first downswing from last week’s high generated the AB leg of the pattern. Also, note that there is a bearish divergence with the relative strength index (RSI). That also implies continued downward pressure. That may change if the trendline on the RSI window is broken to the upside.
Above $4.38 Improves Bull Thesis
Natural gas would first need to rise above last Wednesday’s high of $4.38 and stay above it for the above bearish thesis to begin to change. That would show continued strength and show a reclaim of the January prior trend high of $4.37. If further signs of strength followed, then natural gas would have a chance to challenge and possibly exceed the recent trend high.
50-Day Line is Key
On the downside, the 50-Day MA is critical support for the near-term angle of ascent. However, notice that the recent angle of the trend is higher than it has been. Since the $2.99 swing low from January was well below the 50-Day line, it could easily be broken again.
Natural Gas Price Forecast
Every new Natural Gas analysis as it publishes, today's technical signal and key levels, live price — on one page.
See all Natural Gas forecastsFor a look at all of today’s economic events, check out our economic calendar.



