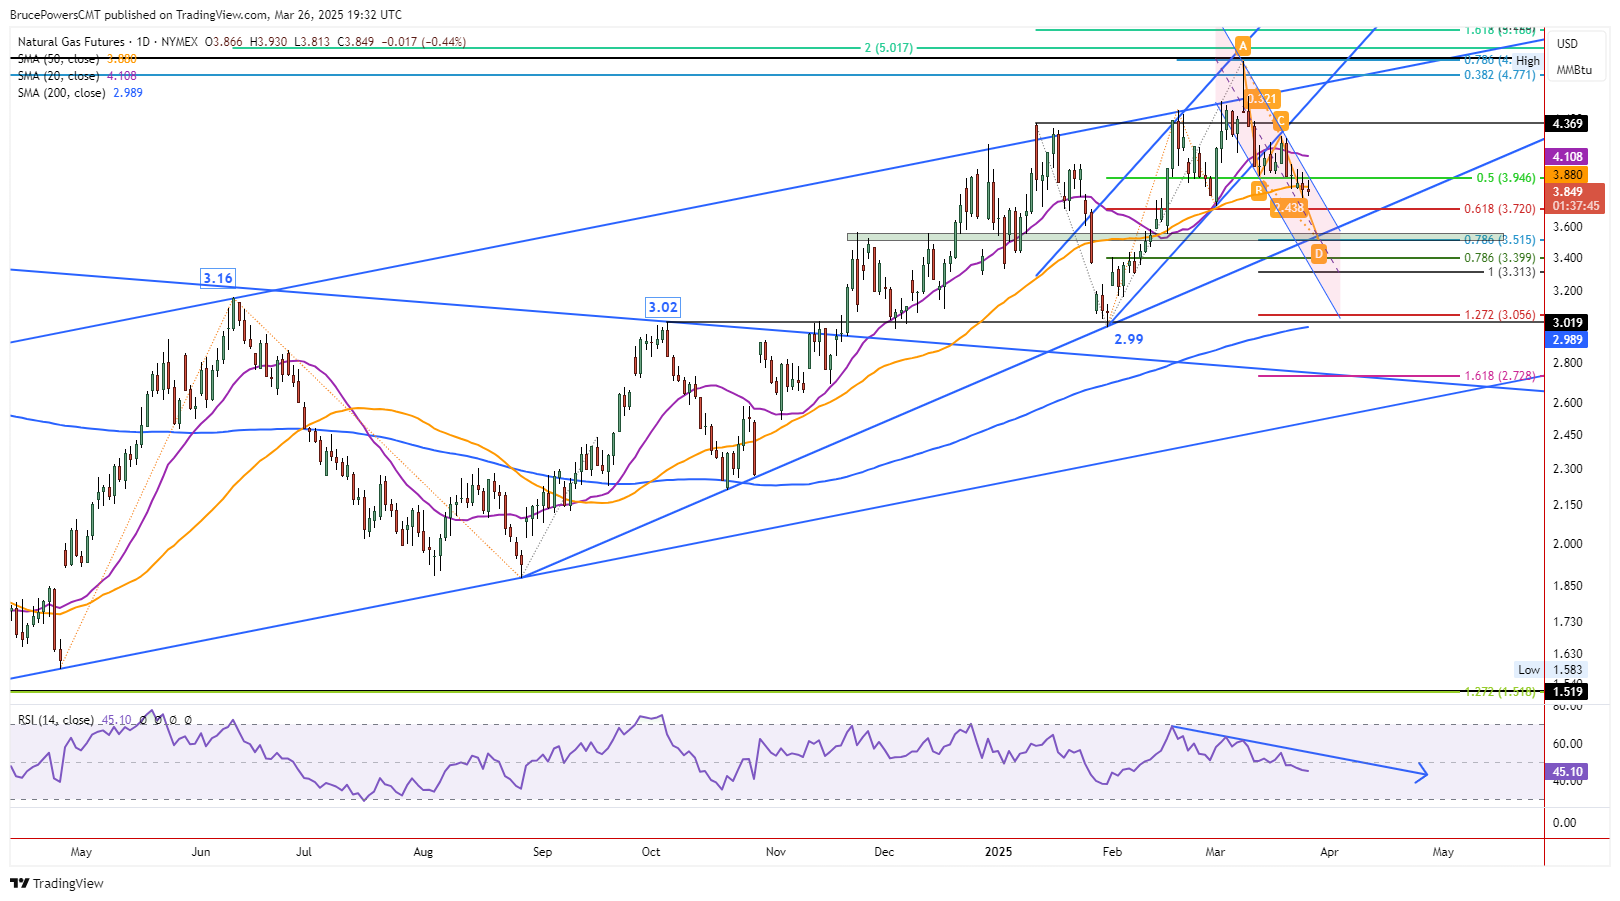
Natural gas remained stalled around the 50-Day MA on Wednesday, and it is set to end the day with a relatively narrow range inside day. The closing price of the day may be telling as the low-to-high range of $3.81 to $3.93 shows that natural gas traded both above and below the 50-Day MA, which is now at $3.88. A daily close below the 50-Day line would be a little more bearish than a daily close above the line.
In addition, Wednesday’s high was a successful test of resistance at the recent interim swing low of $3.96 in mid-March, showing a prior support zone converting to a resistance zone. This doesn’t mean the today’s high can’t be breached, but for now it further confirms the progression of the bearish trend.

Minor Bearish Signs Seen
A descending trend channel has been added to the chart as today’s high was also close to that line. And it will be closer to price action tomorrow. The price area around the line will either show signs of resistance or a breakout through the line will occur. But regardless of which, subsequent price behavior should be more revealing.
Given the pattern within the declining channel and the drop below the 50-Day MA yesterday, it seems like lower prices may be tested as support before the correction is complete. However, the short-term outlook could change if there is a decisive breakout above today’s high and then a daily close above the trendline and the 50% retracement level at $5.95, which represented support recently on the way down.
Dominated by Declining Channel
Notice that the price of natural gas is now near the top of the trend channel. If a decline below today’s low is triggered that could be enough to accelerate the bearish correction. In general, once price reverses from one side of the channel there is a tendency to start to move toward the other side, which is the lower channel line. Regardless of whether natural gas eventually falls to the lower channel line, it implies lower prices.
Although the next potential support zone is around the early-March interim swing low at $3.74, the progression of the bear trend may be strong enough to fall through it. If that occurs, then the next lower uptrend line is the area to watch for support and the integrity of the uptrend that the line is associated with.
Natural Gas Price Forecast
Every new Natural Gas analysis as it publishes, today's technical signal and key levels, live price — on one page.
See all Natural Gas forecastsFor a look at all of today’s economic events, check out our economic calendar.