Natural gas broke out of last week’s price range on Monday with a decisive advance above 2.82. Further, the recent high of 2.92 was exceeded to the upside and it is possible that today may close above that price level. Trading remains strong at the time of this writing and continues near the highs of the day. The low for the day was 2.77.
Today’s high of 2.96 tested resistance around the top boundary line of a large symmetrical triangle pattern. Watch closely to see if natural gas can break through the line towards the recent swing high of 3.02. That high is part of lower swing highs that met resistance following the 2023 peak.
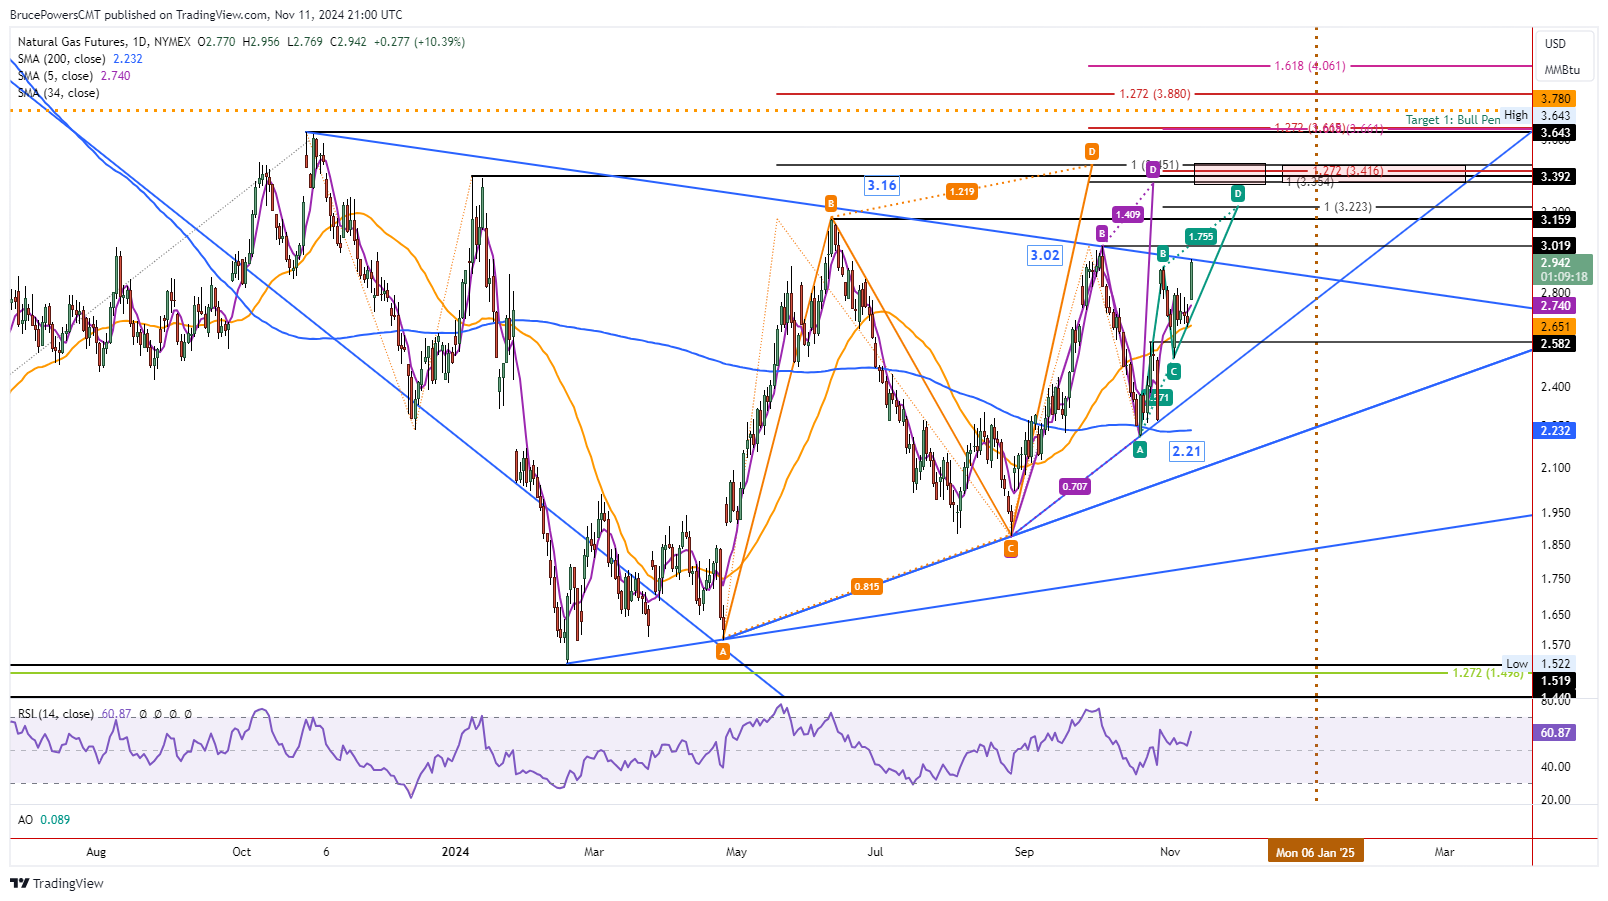

Potential Triangle Bull Breakout
As of today, there is a potential bull breakout of a symmetrical triangle formation approaching. A rise above the top line will provide an initial sign of a potential breakout. However, since the swing high of 3.02 is not too much higher, a decisive advance above that price level should provide a more reliable bullish signal as it will further confirm strength. A trendline break alone generally needs further confirmation for greater validation.
Price Structure Targets
Let’s look at a couple ways to consider upside targets. First, previous price structure marks potential resistance. Each prior swing high within the triangle pattern identifies a potential resistance zone as it was an area of resistance in the recent past as the triangle formation evolved. The swing high of 3.02 is followed by the peak from June at 3.16. Next up is the swing high from January at 3.39, followed by the 2023 peak at 3.64.
Price Symmetry Targets
Then, price symmetry is analyzed looking for potential pivots where there is a match between swings, A pivot area could lead to a pullback or a breakthrough. There are three rising ABCD patterns shown on the chart to highlight price symmetry. The largest pattern is shown in orange, and it begins from the April swing low (A).
Since it is the largest pattern as it covers the longest time frame, it identifies the potentially more significant price target, which is 3.45. The next rising ABCD pattern is in purple, and it points to a potential pivot at 3.35. A more recent and therefore smaller rising ABCD pattern in green points to a potential initial pilot of 3.22 for natural gas once a sustained breakout of the triangle occurs.
Natural Gas Price Forecast
Every new Natural Gas analysis as it publishes, today's technical signal and key levels, live price — on one page.
See all Natural Gas forecastsFor a look at all of today’s economic events, check out our economic calendar.