
Crude Drops 8% on a Deal That Does Not Exist
The market gapped lower Sunday night and kept falling into Monday on the same Hormuz diplomacy trade that has burned sellers twice already this summer.
Iran stopped two tankers Friday and turned four more around. Two large crude carriers made it through. That is the physical reality. The price action is trading something else entirely. It is trading the hope that Oman can produce an agreement that neither Washington nor Tehran has agreed to, and it is doing it with enough conviction to erase nearly $7 from WTI on the open.
The shorts got squeezed pressing this same trade in mid-July and again late in the month. Both times the headlines ran ahead of the ships. Both times the supply premium came back fast. Monday’s gap lower is bigger than either of those, and the tanker count has not moved.

Weekly September WTI Crude Oil Futures Technical Analysis
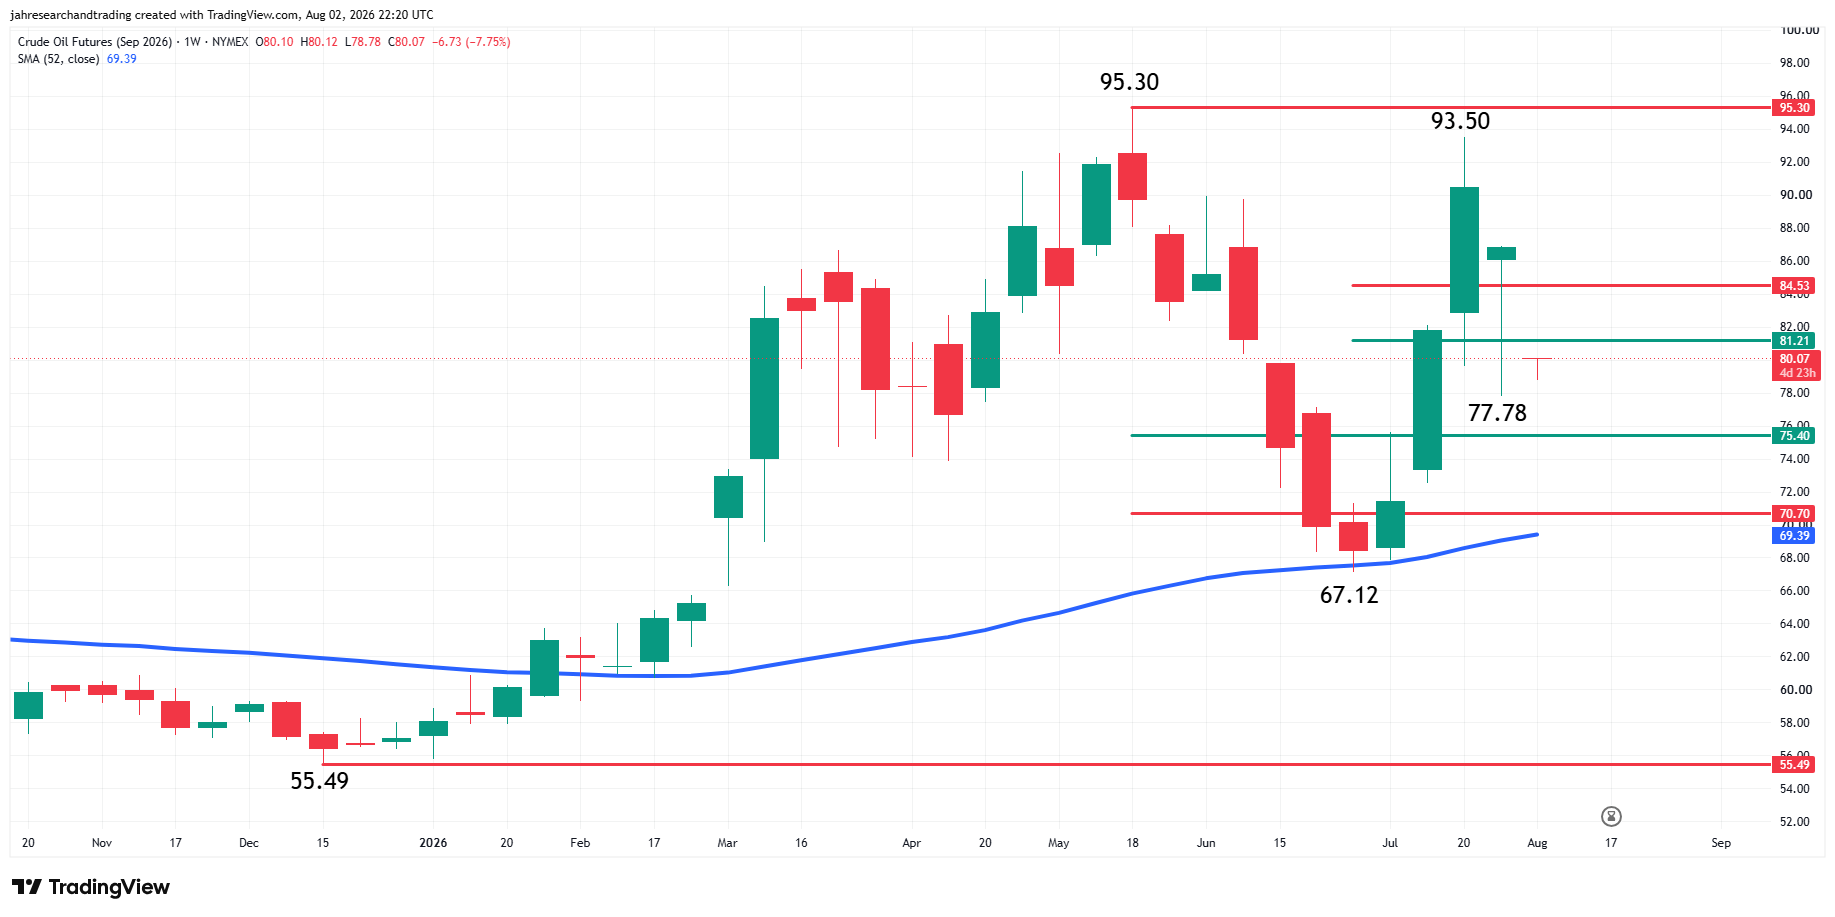
September WTI crude oil futures are sharply lower early Sunday. The trend is mixed, leading to the recent choppy, two-sided trade. For those following the 52-week moving average, the trend is up with support at $69.39. The main swing chart indicates the trend is down. A trade through $95.30 will change the main trend to up, while a move through $67.12 reaffirms the downtrend.
Price action is also being governed by retracement zones at $81.21 to $84.53 and $75.40 to $70.70. Sunday’s weak opening at $79.91 put the market below the first zone, turning former support into resistance. The lower zone is the next support area.
Weekly October Brent Crude Oil Futures Technical Analysis
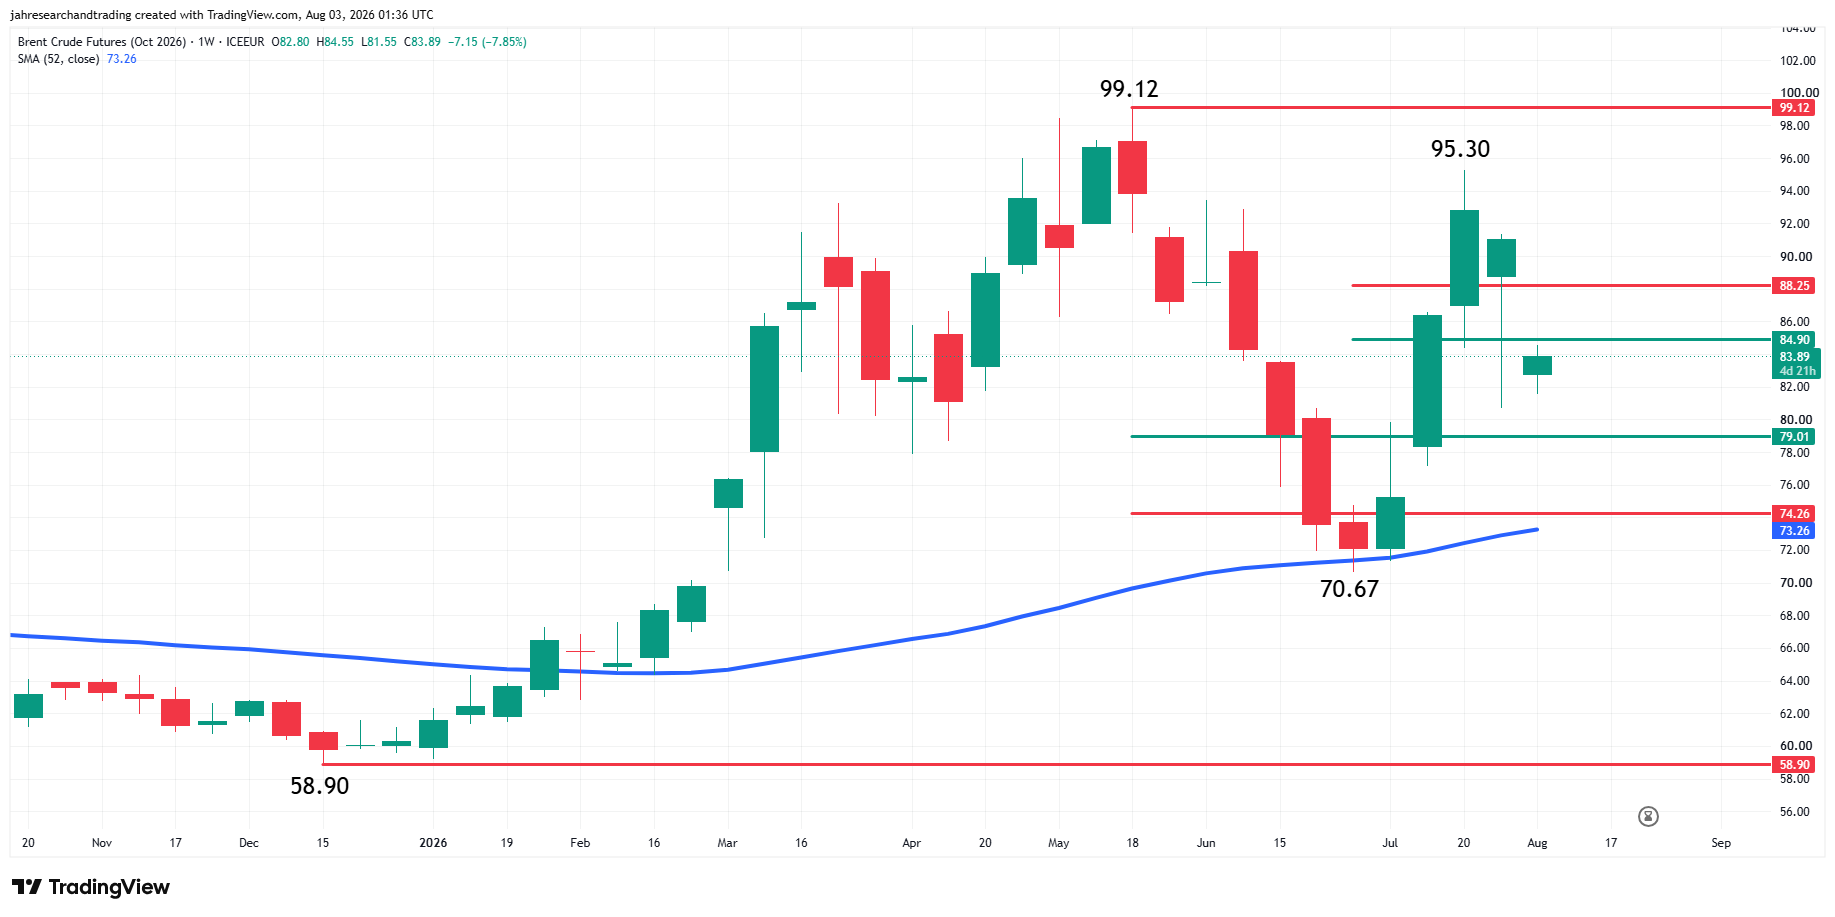
October Brent Crude oil futures plunged early Sunday. Shortly after the opening, September WTI crude oil futures are trading $83.62, down $7.42 or -8.15%.
Rangebound is the best way to describe the price action since the May top at $99.12. The market is being capped by the July top at $95.30 and the May top. But it’s being supported by the 52-week moving average at $73.26 and the swing bottom at $70.67.
Brent Oil Price Forecast
Every new Brent Oil analysis as it publishes, today's technical signal and key levels, live price — on one page.
See all Brent Oil forecastsThe price action is also being controlled by retracement zone resistance at $84.90 to $88.25 and retracement zone support at $79.01 to $74.26.
With the early downside bias, sellers may make a move into the $79.01 to $74.26 support zone. A sustained move through $74.26 would put the 52-week moving average at $73.26 in play.
U.S. Inventories Are Still Draining
Commercial crude stocks hit their lowest level since 2018 last week and Wednesday’s EIA report is the next domestic read. The draw has been backing up the WTI floor while Middle East cargoes stay unreliable, and Cushing sitting near decade lows means the delivery point for WTI futures is getting thin at the worst possible time.
Demand fell more than 3.5% to about 20.07 million barrels per day recently. Crude at $80-plus is starting to bite and the consumption number is the one thing bulls cannot afford to ignore. The same traders who got squeezed ignoring the ship count in July should not make the reverse mistake now by pretending demand does not matter at these prices.
The Ships Are Still Not Moving
Revolutionary Guard forces stopped two tankers Friday and turned four others back. Two crude carriers made it through. That ratio is not improving, and Monday’s 8% selloff is priced as if it already has.
The bears need days of rising two-way traffic before this trade is anything more than another diplomatic head fake that gets bought back when the headlines fade. They needed that in July too. They never got it. The shorts pressed crude lower on Oman headlines twice last month and covered at a loss both times when the ship count stayed flat. Monday’s gap is bigger than either of those moves, and the tanker data has not changed.
The Red Sea is not bailing anyone out. The Houthis declared a maritime embargo against Saudi Arabia three weeks ago and the southern approach to the Suez is another threat zone. Saudi Arabia pushing for a multinational defense coalition is not something a country does when it expects the shipping problem to resolve through talks. Two exits from the Gulf are compromised and the workaround for one runs through the other.
OPEC+ Raised Quotas Into a Broken Export System
OPEC+ agreed Sunday to add 188,000 barrels per day in September, completing the return of 1.65 million barrels per day from voluntary cuts. The market barely reacted because it has watched this play out before. Quota increases that cannot reach buyers through impaired shipping lanes are not supply. They are numbers on a spreadsheet that stay there until the tankers start moving.
The increase matters if Hormuz reopens. It does not matter while the strait is operating the way it operated on Friday.
What to Watch
The market sold crude nearly 8% on diplomacy it cannot confirm. The last two times sellers tried this trade the supply premium snapped back within days because the ship count never followed the headlines. Monday’s gap is bigger than either of those moves. The tanker data has not changed. Wednesday’s EIA report is the domestic catalyst, and the shipping data through Hormuz and Bab el-Mandeb is the confirmation that either validates the selloff or exposes it as the third diplomatic head fake since mid-July.
WTI gapped below its upper retracement zone and turned it into resistance. Brent is pressing toward its own support cluster. The technicals say the chop continues inside these wide ranges until one side gets a breakout, and the breakout comes from the ships, not the talks.
If you’d like to know more about how to trade crude oil, please visit our educational area.