Oil prices edged up as the war between the U.S. and Iran resumed. Brent crude climbed to $93.60 per barrel and WTI oil to $87. The conflict sparked concerns about strikes against the energy facilities in the Gulf. It also increased the risk to shipping traffic through the Strait of Hormuz. The waterway transported about 20% of the world’s oil prior to the war. Any further disruptions could reduce supply and drive up prices.
The oil market also lacks some of the buffers that it previously had to absorb another supply shock. Oil flows through Hormuz remain well below their pre-conflict level. Inventories in the U.S. are approaching low levels and the Strategic Petroleum Reserve has dropped to 286.6 million barrels. Seasonal demand from China could add more pressure. These factors could help to maintain support for Brent and WTI in the short term. But the reopening of the Strait or ceasefire may take out some of the risk premium and pull prices lower.

WTI Crude Oil Price Tests $87 Breakout
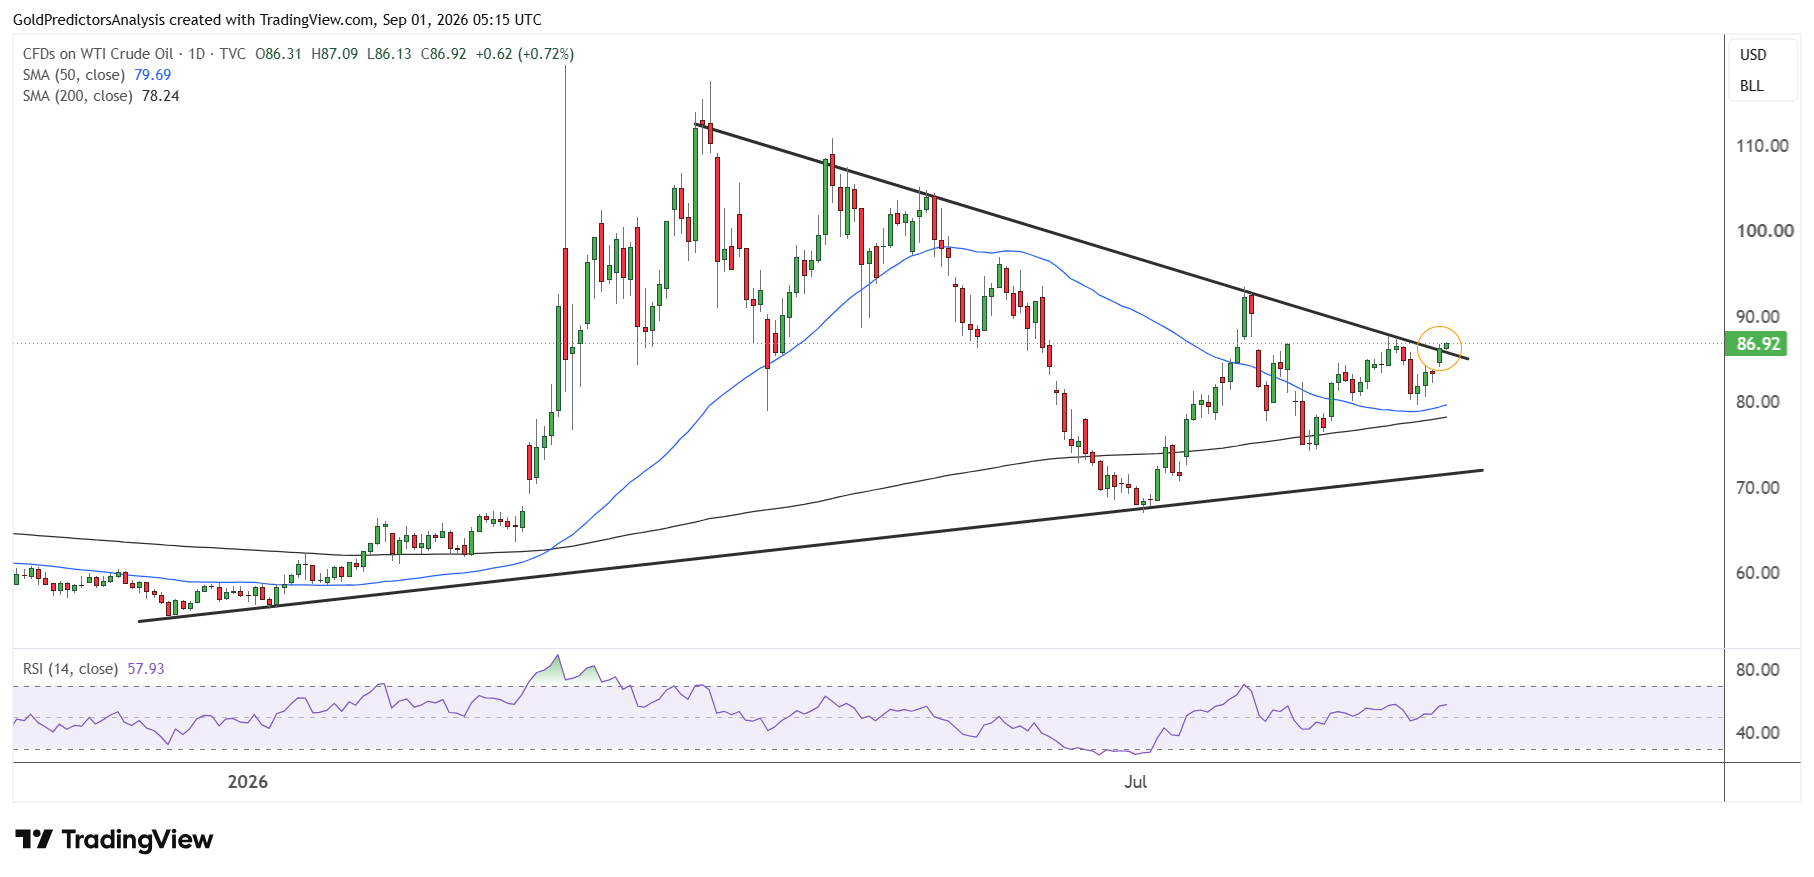
The daily chart for WTI shows that the price has formed a bullish structure above the 50- and 200-day SMAs within the triangle pattern. The price is now attempting to break above this triangle at the $87 area and looks for higher prices. The RSI remains above the midline, which points to further upside in the short term.
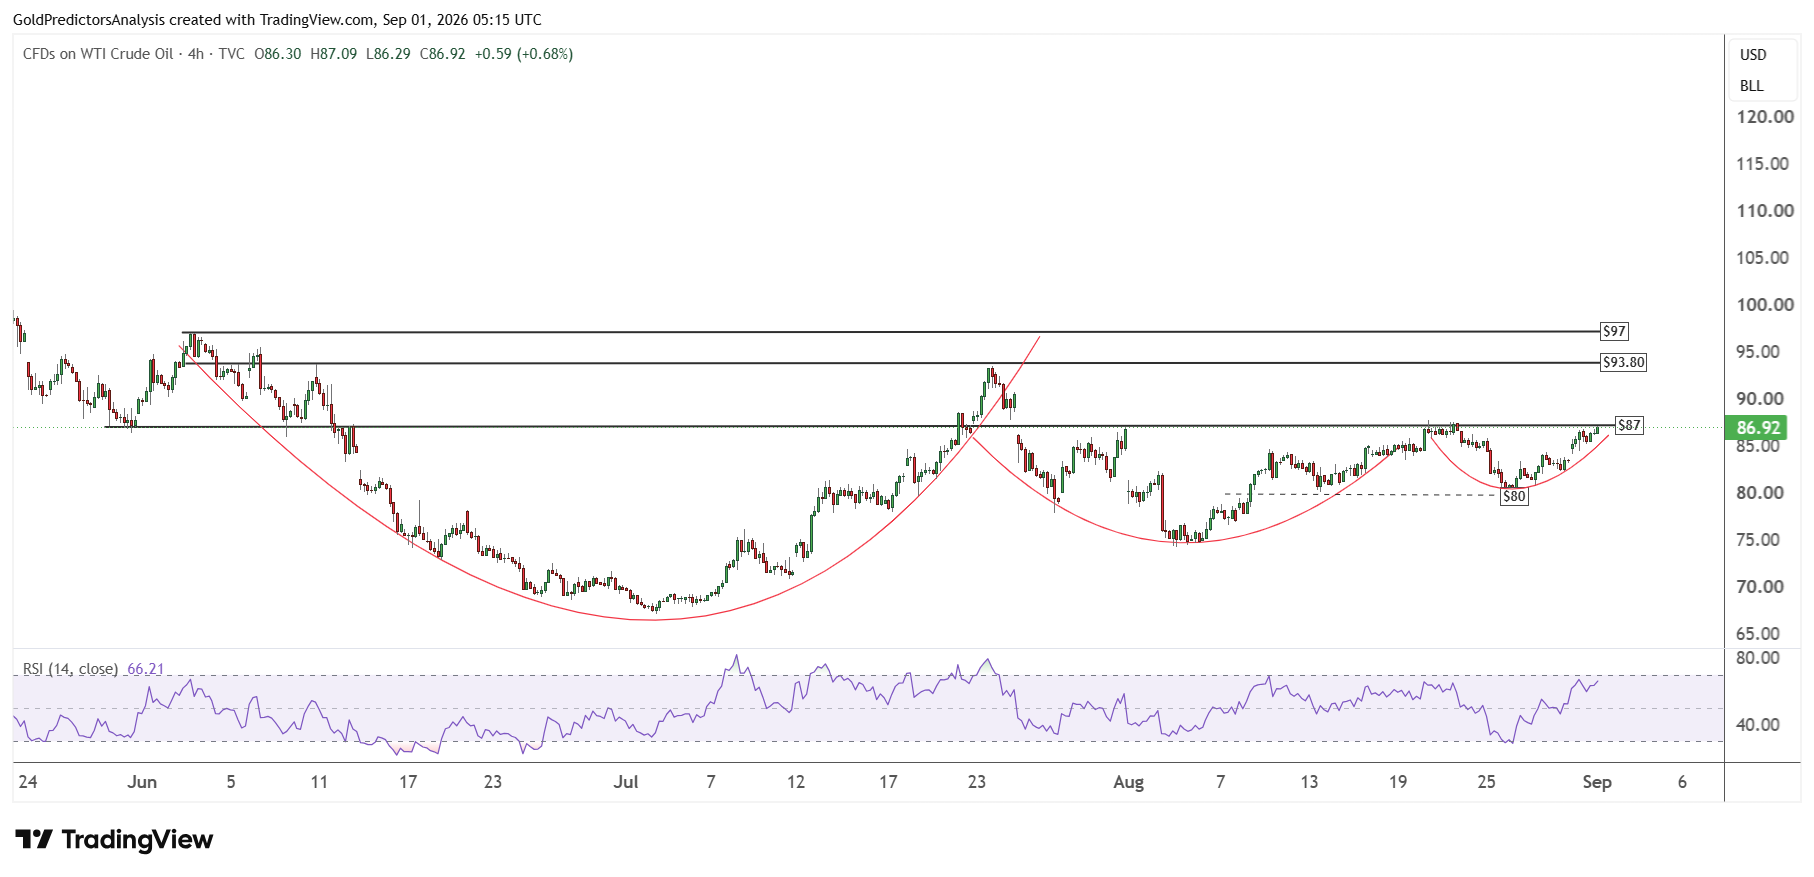
The 4-hour chart for WTI crude oil also highlights the importance of current resistance at $87. The price has formed a rounding bottom pattern above the $80 support, which points to positive momentum in the crude oil market. A break above $87 will push prices toward $93.80 and $97 levels in the short term.
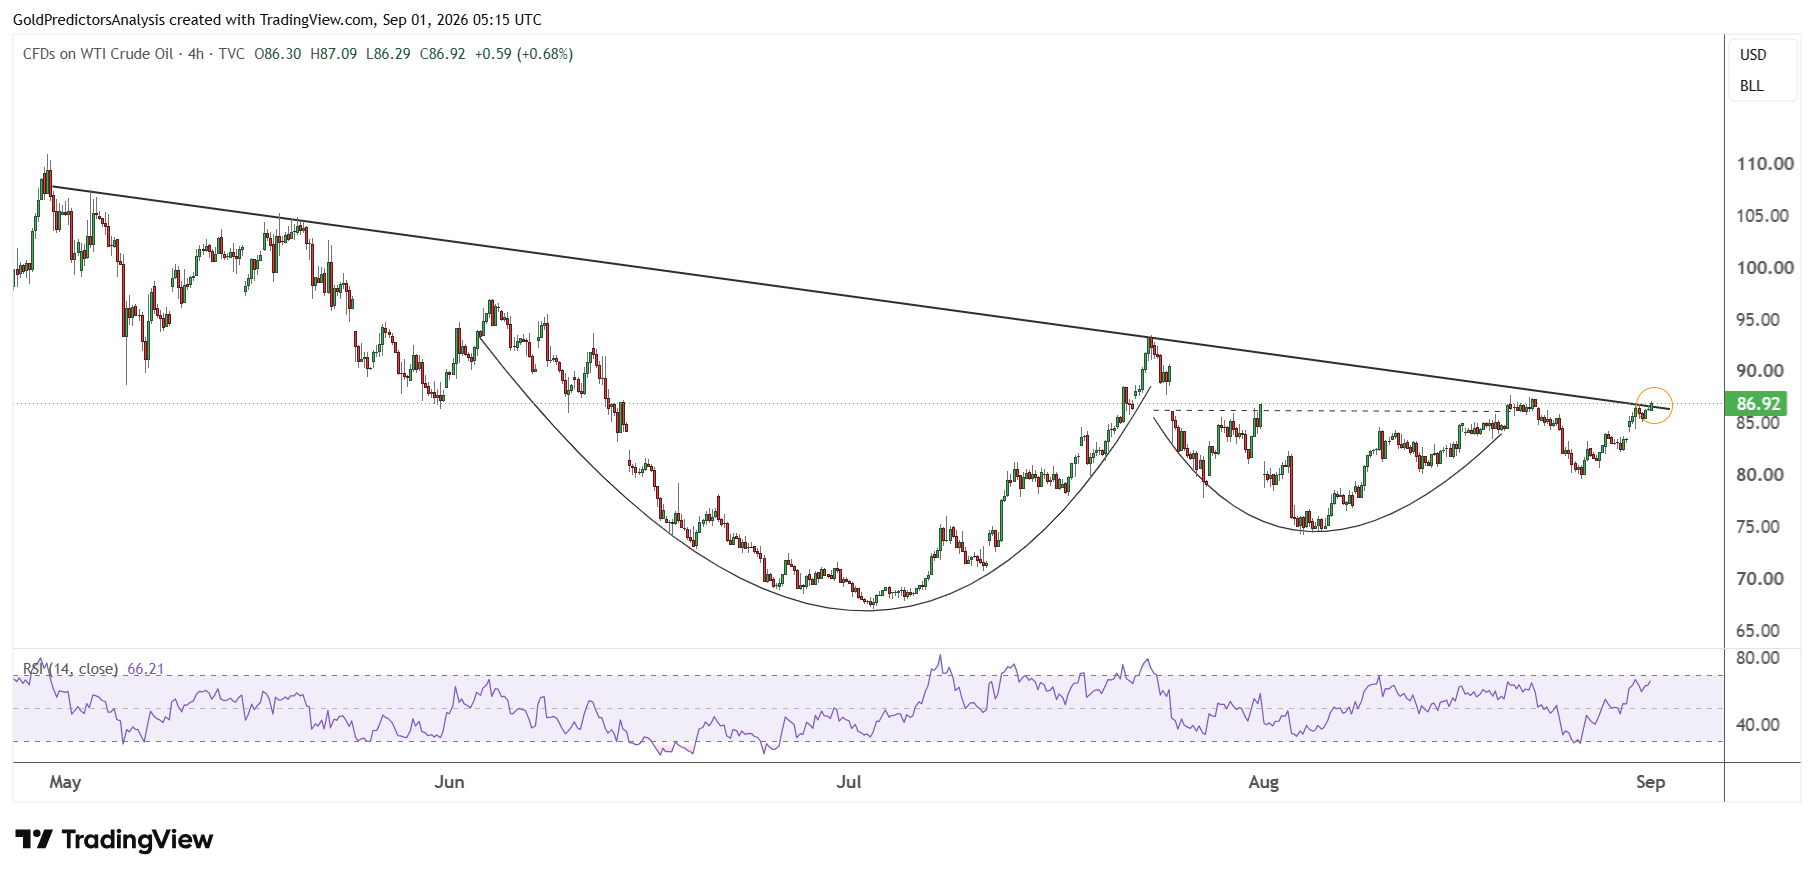
The rounding bottom pattern also appears on another chart, which shows resistance at $87 from the descending trend line that stretches from the April 2026 highs.
Brent Oil Price Forecast
Every new Brent Oil analysis as it publishes, today's technical signal and key levels, live price — on one page.
See all Brent Oil forecastsBrent Crude Oil Price Eyes $100
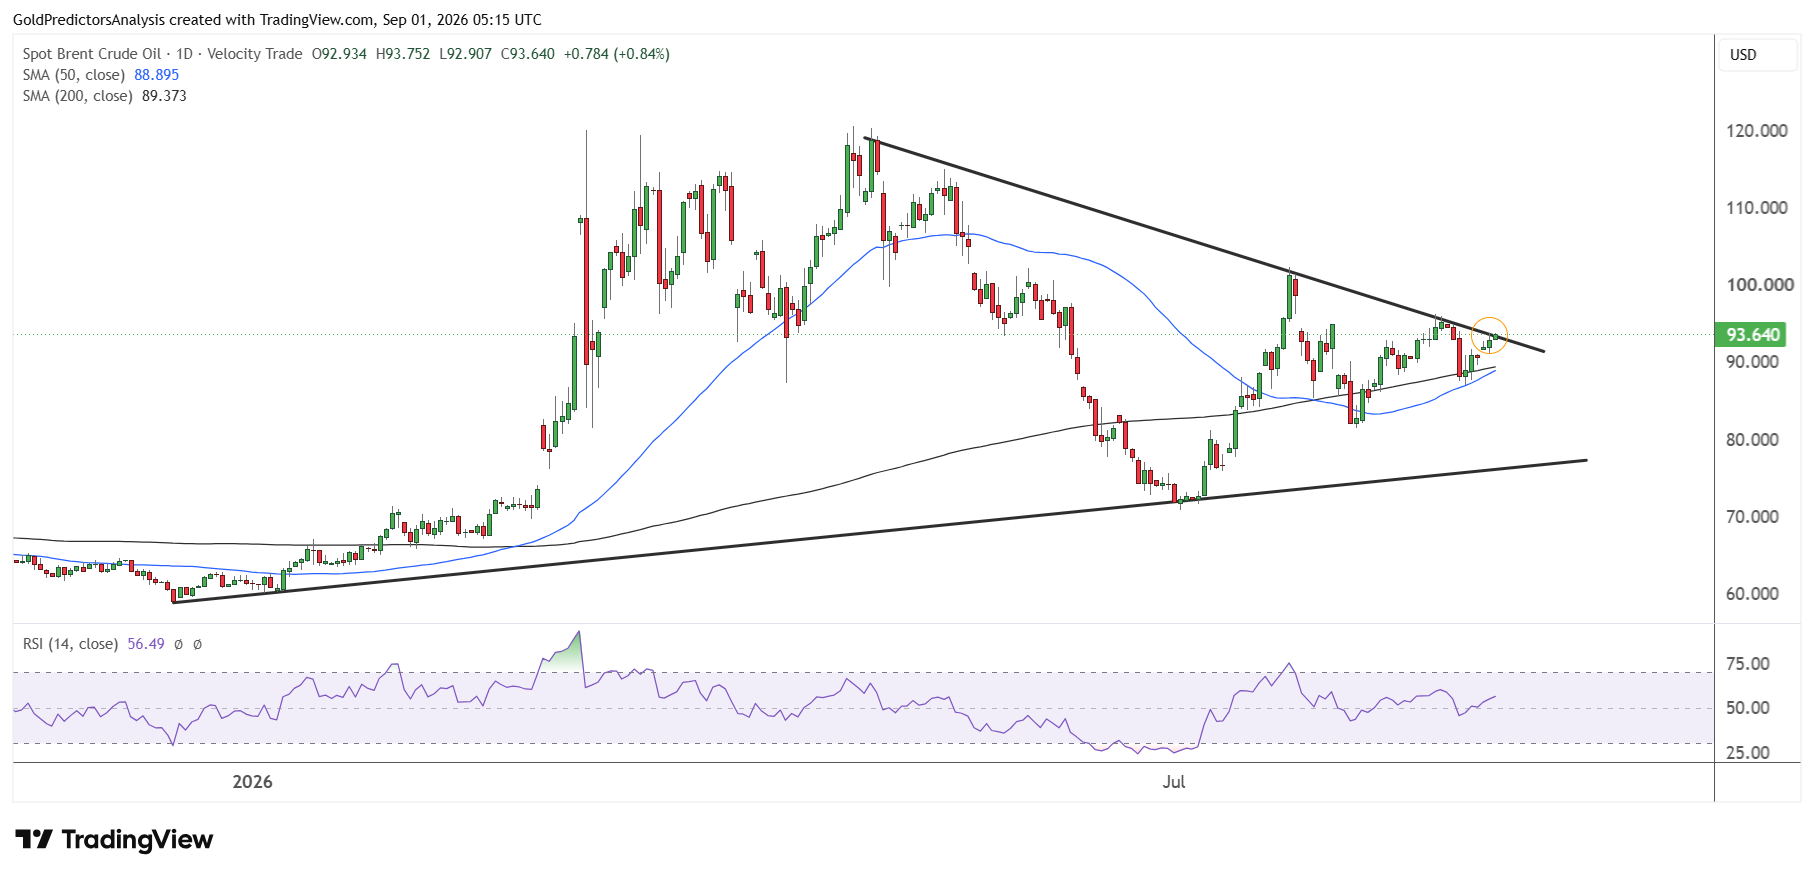
Brent crude oil also shows the formation of a triangle pattern. The price is attempting to break above this triangle after consolidating over the past few days. The price remains above the 50- and 200-day SMAs and suggests positive momentum in the short term. The RSI remains above the midline, which also points to short term strength.
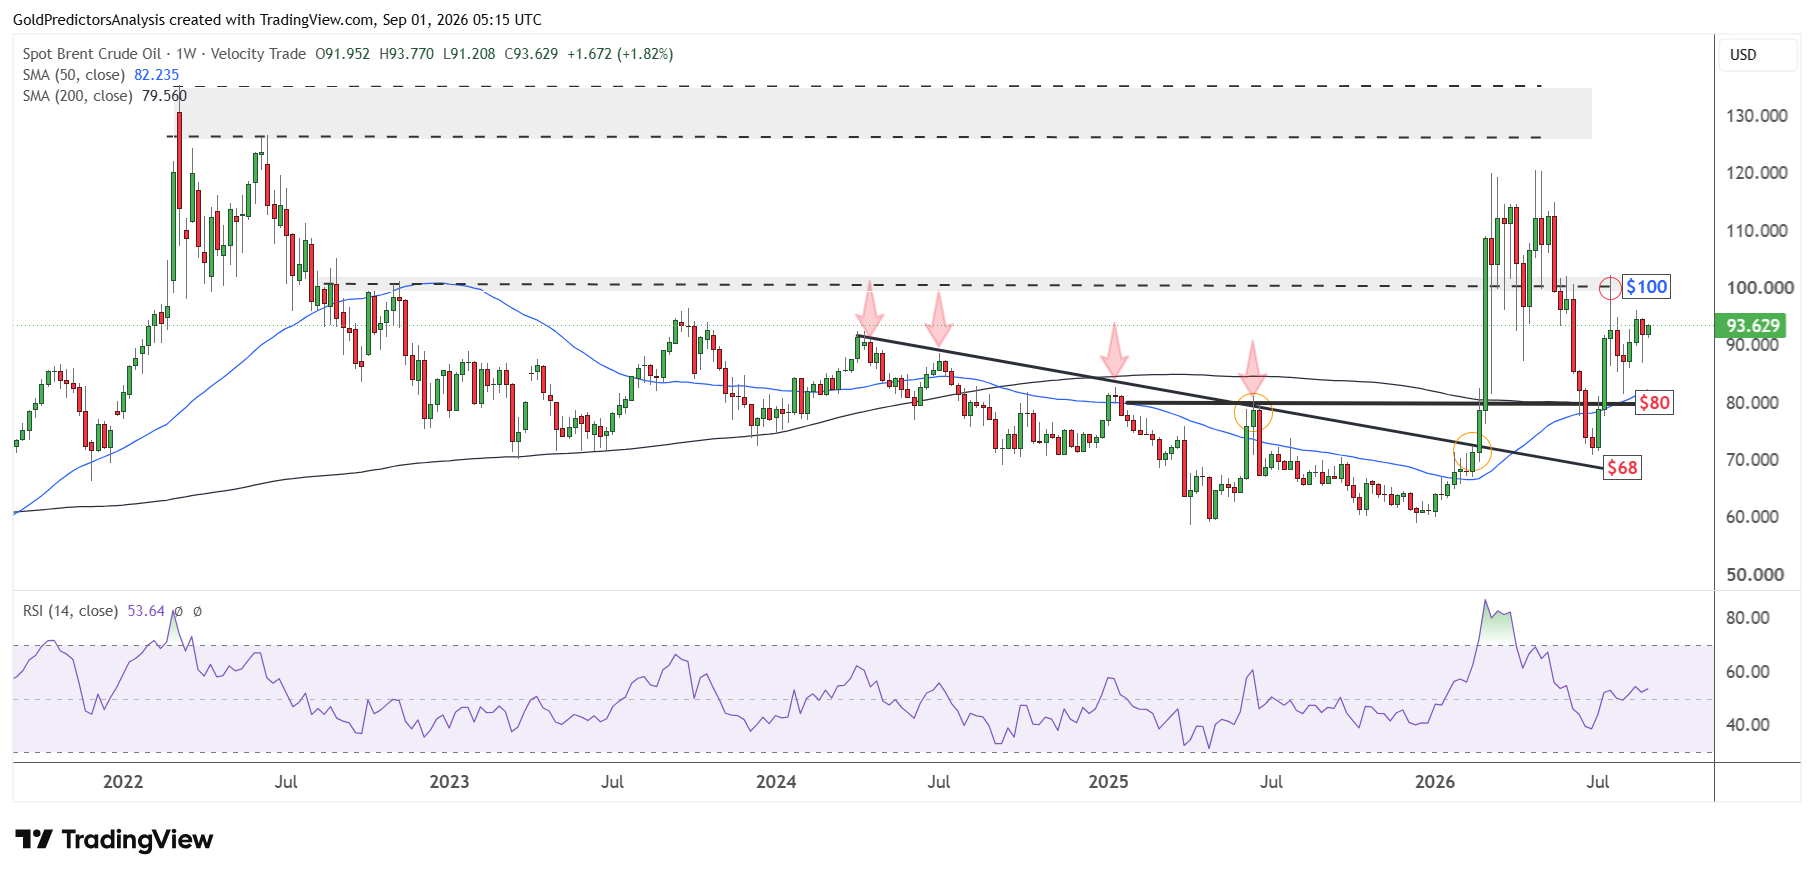
The weekly chart for Brent crude oil also shows a positive structure above the $80 support. The $80 support is observed at the 50-week SMA and indicates that prices may push toward $100 in the short term. A break above $100 is required to push Brent oil toward the $120 area. The RSI remains above the midline on the weekly chart which further strengthens the bullish outlook for Brent oil.
Oil Price Outlook Remains Bullish as Hormuz Risks Grow
The short term outlook for the oil market remains bullish as renewed U.S.-Iran tensions threaten supplies through the Strait of Hormuz. The low inventories and reduced oil flows leave the market vulnerable to another supply shock. WTI oil must break above $87 to target $93.80 and $97. On the other hand, Brent oil could move toward $100 as long as it holds above the $80 support. A break above $100 could open the way toward $120. But a ceasefire or the reopening of the strait could remove the risk premium and pull oil prices lower.
Read more: If you’d like to know more about how to trade crude oil, please visit our educational area.