Silver Technical Analysis
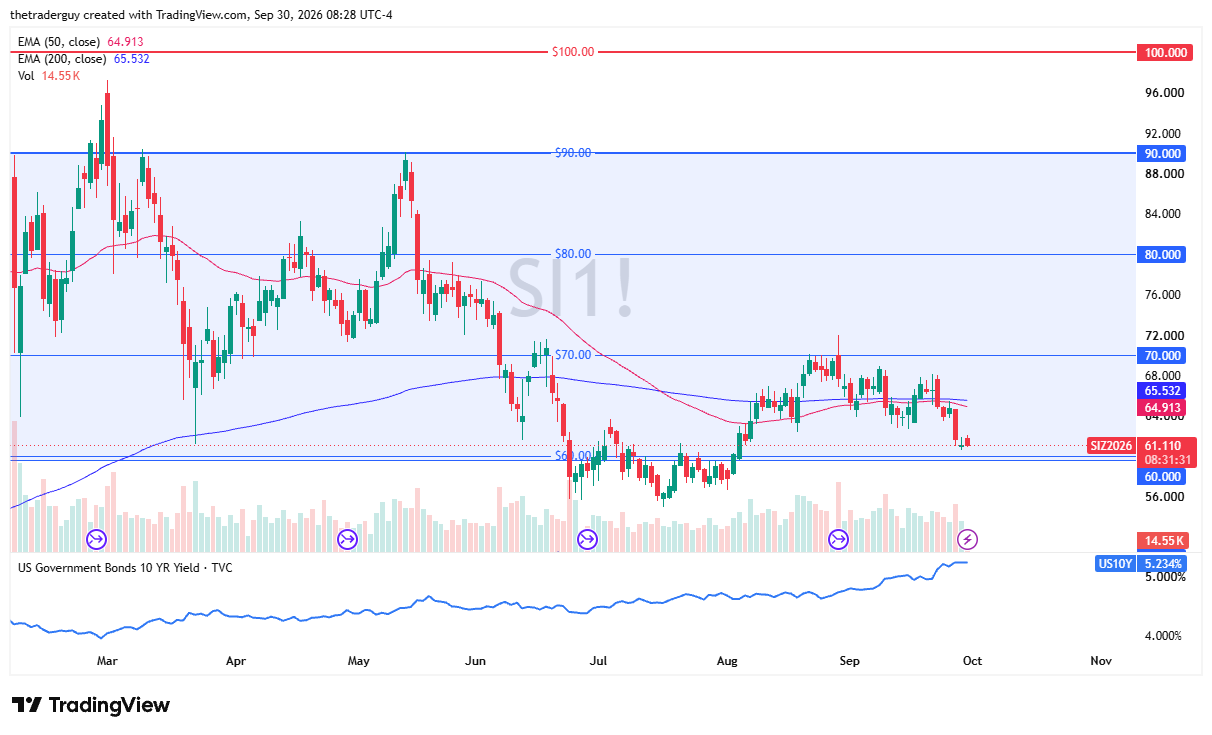
Silver markets gapped higher to kick off the trading session on Wednesday as interest rates are giving the markets a little bit of relief. Ultimately, this is a market that will continue to see a lot of questions asked about interest rates and where we are going next with the Federal Reserve.
Silver Price Forecast
Every new Silver analysis as it publishes, today's technical signal and key levels, live price — on one page.
See all Silver forecastsThe PCE numbers came out early during the session in New York. They were a little lower than anticipated. That being said, we do have a jobs report coming out on Friday that will have a major influence as well.
But $60 is an area that had attracted a lot of trading previously. All things being equal, this is a market that traders have been watching very closely. Whether or not we can pick up any momentum, I think at this point in time, it still is a market that is going to be difficult to get aggressive in, mainly due to the reactions to bond yields and the fact that those yields are being pushed by things like headlines out of the Middle East. How do we really trade that with any type of confidence?

Long-term demand
Longer term, I do like silver a lot. There is a deficit of silver. There has been for years, but it is really starting to accelerate now that we are talking about electrifying everything. $60, I think, remains very important for this market. We will see whether or not that holds as support. It extends all the way down to $56.
To the upside, the 50-day EMA and the 200-day EMA are both at $65, and then after that, we have $70. Both of those could be resistance.
Ultimately, I think we are still kind of stuck in a range. I do not see this gap higher as anything major. I believe at this point in time, consolidation is probably the best word I would use to describe what we are seeing.
If you’d like to know more about how to trade gold and silver, please visit our educational area.