

A 40%-Plus Crash Likely For Solana Against Ethereum
The SOL/ETH trading pair is currently exhibiting a rising wedge pattern on its weekly chart, a classic bearish setup often indicative of an impending price correction.
Rising wedges are characterized by converging trendlines, with the upper boundary showing a weaker upward slope relative to the lower boundary. This suggests diminishing bullish momentum, raising the likelihood of a price breakdown.
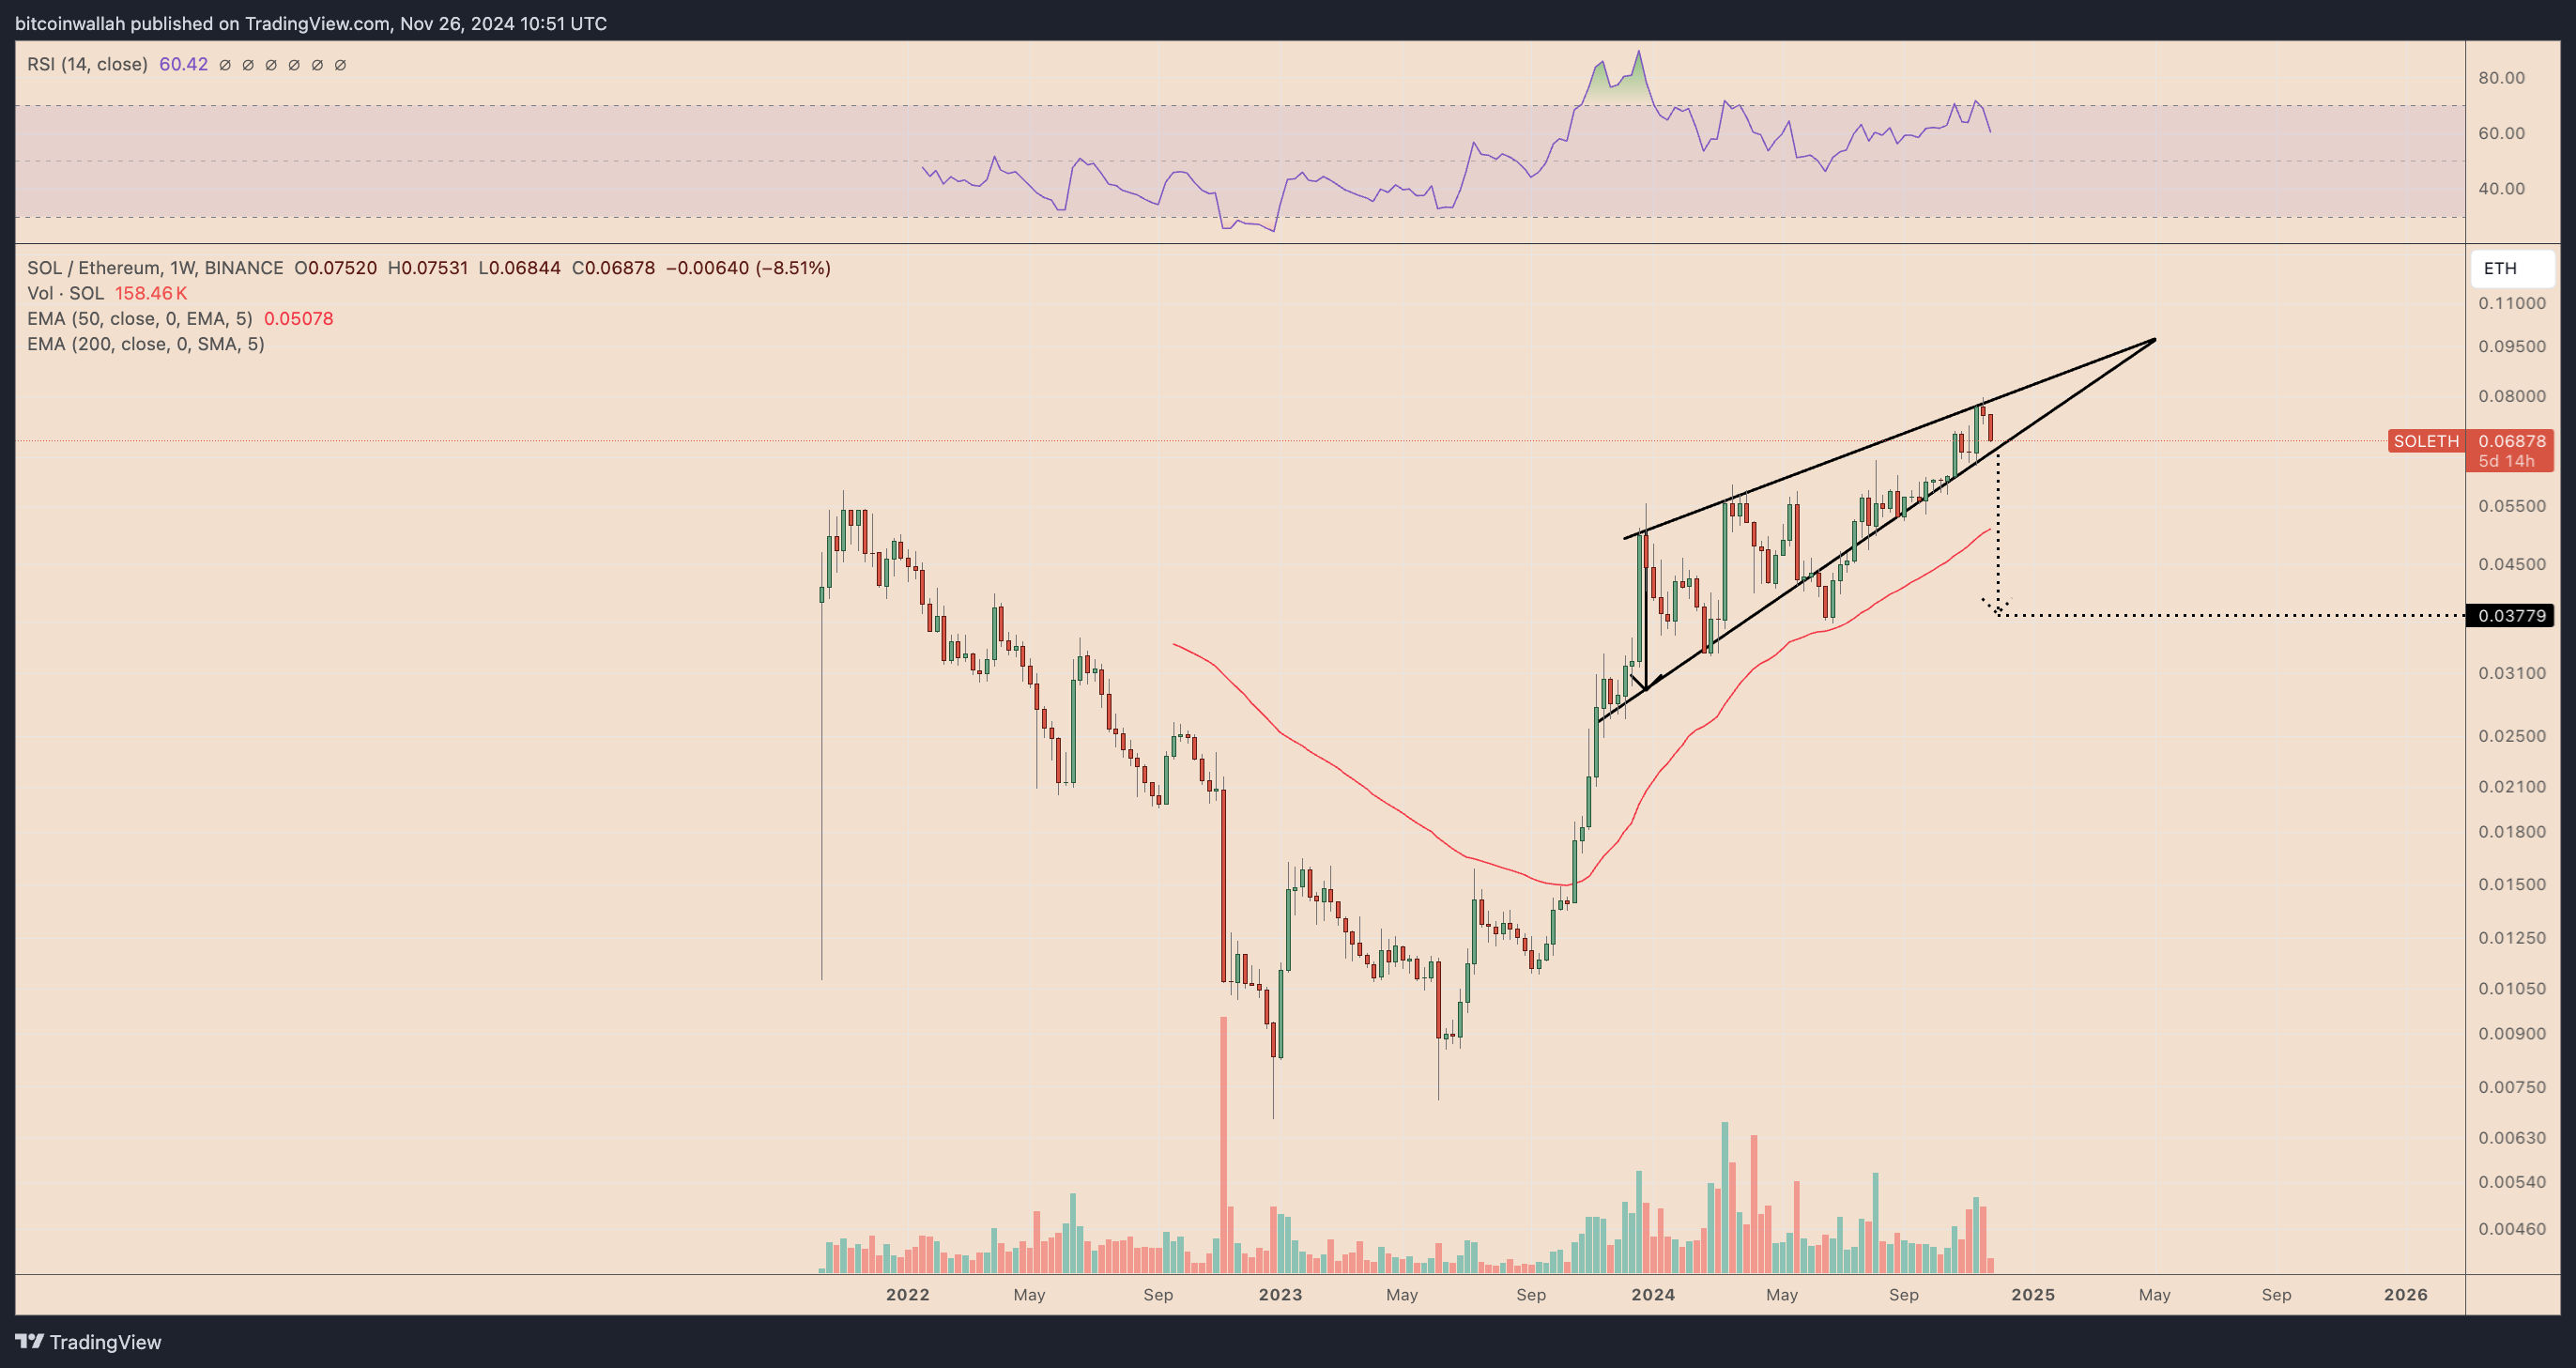
A breakdown below the wedge’s lower trendline could initiate a sharp price correction, targeting the measured move distance equivalent to the wedge’s maximum height.
As depicted in the chart, this brings a potential downside target near the 0.03779 ETH level, down about 45% from the current price levels. Declining trading volumes align with the rising wedge structure and further support the bearish outlook.
Additionally, the SOL/ETH price remains far above its 50-week exponential moving average (EMA), located near 0.05057 ETH, leaving room for a mean-reversion move. A sustained breach below the EMA could confirm the bearish bias, amplifying sell pressure.
Solana Price Forecast
Every new Solana analysis as it publishes, today's technical signal and key levels, live price — on one page.
See all Solana forecastsEthereum and Solana’s Dollar Price Targets For December
Ethereum is displaying a bullish ascending triangle pattern on the weekly chart, a technical setup often associated with upward price continuation. The triangle’s horizontal resistance at approximately $4,000 is the key upside target to watch in December.
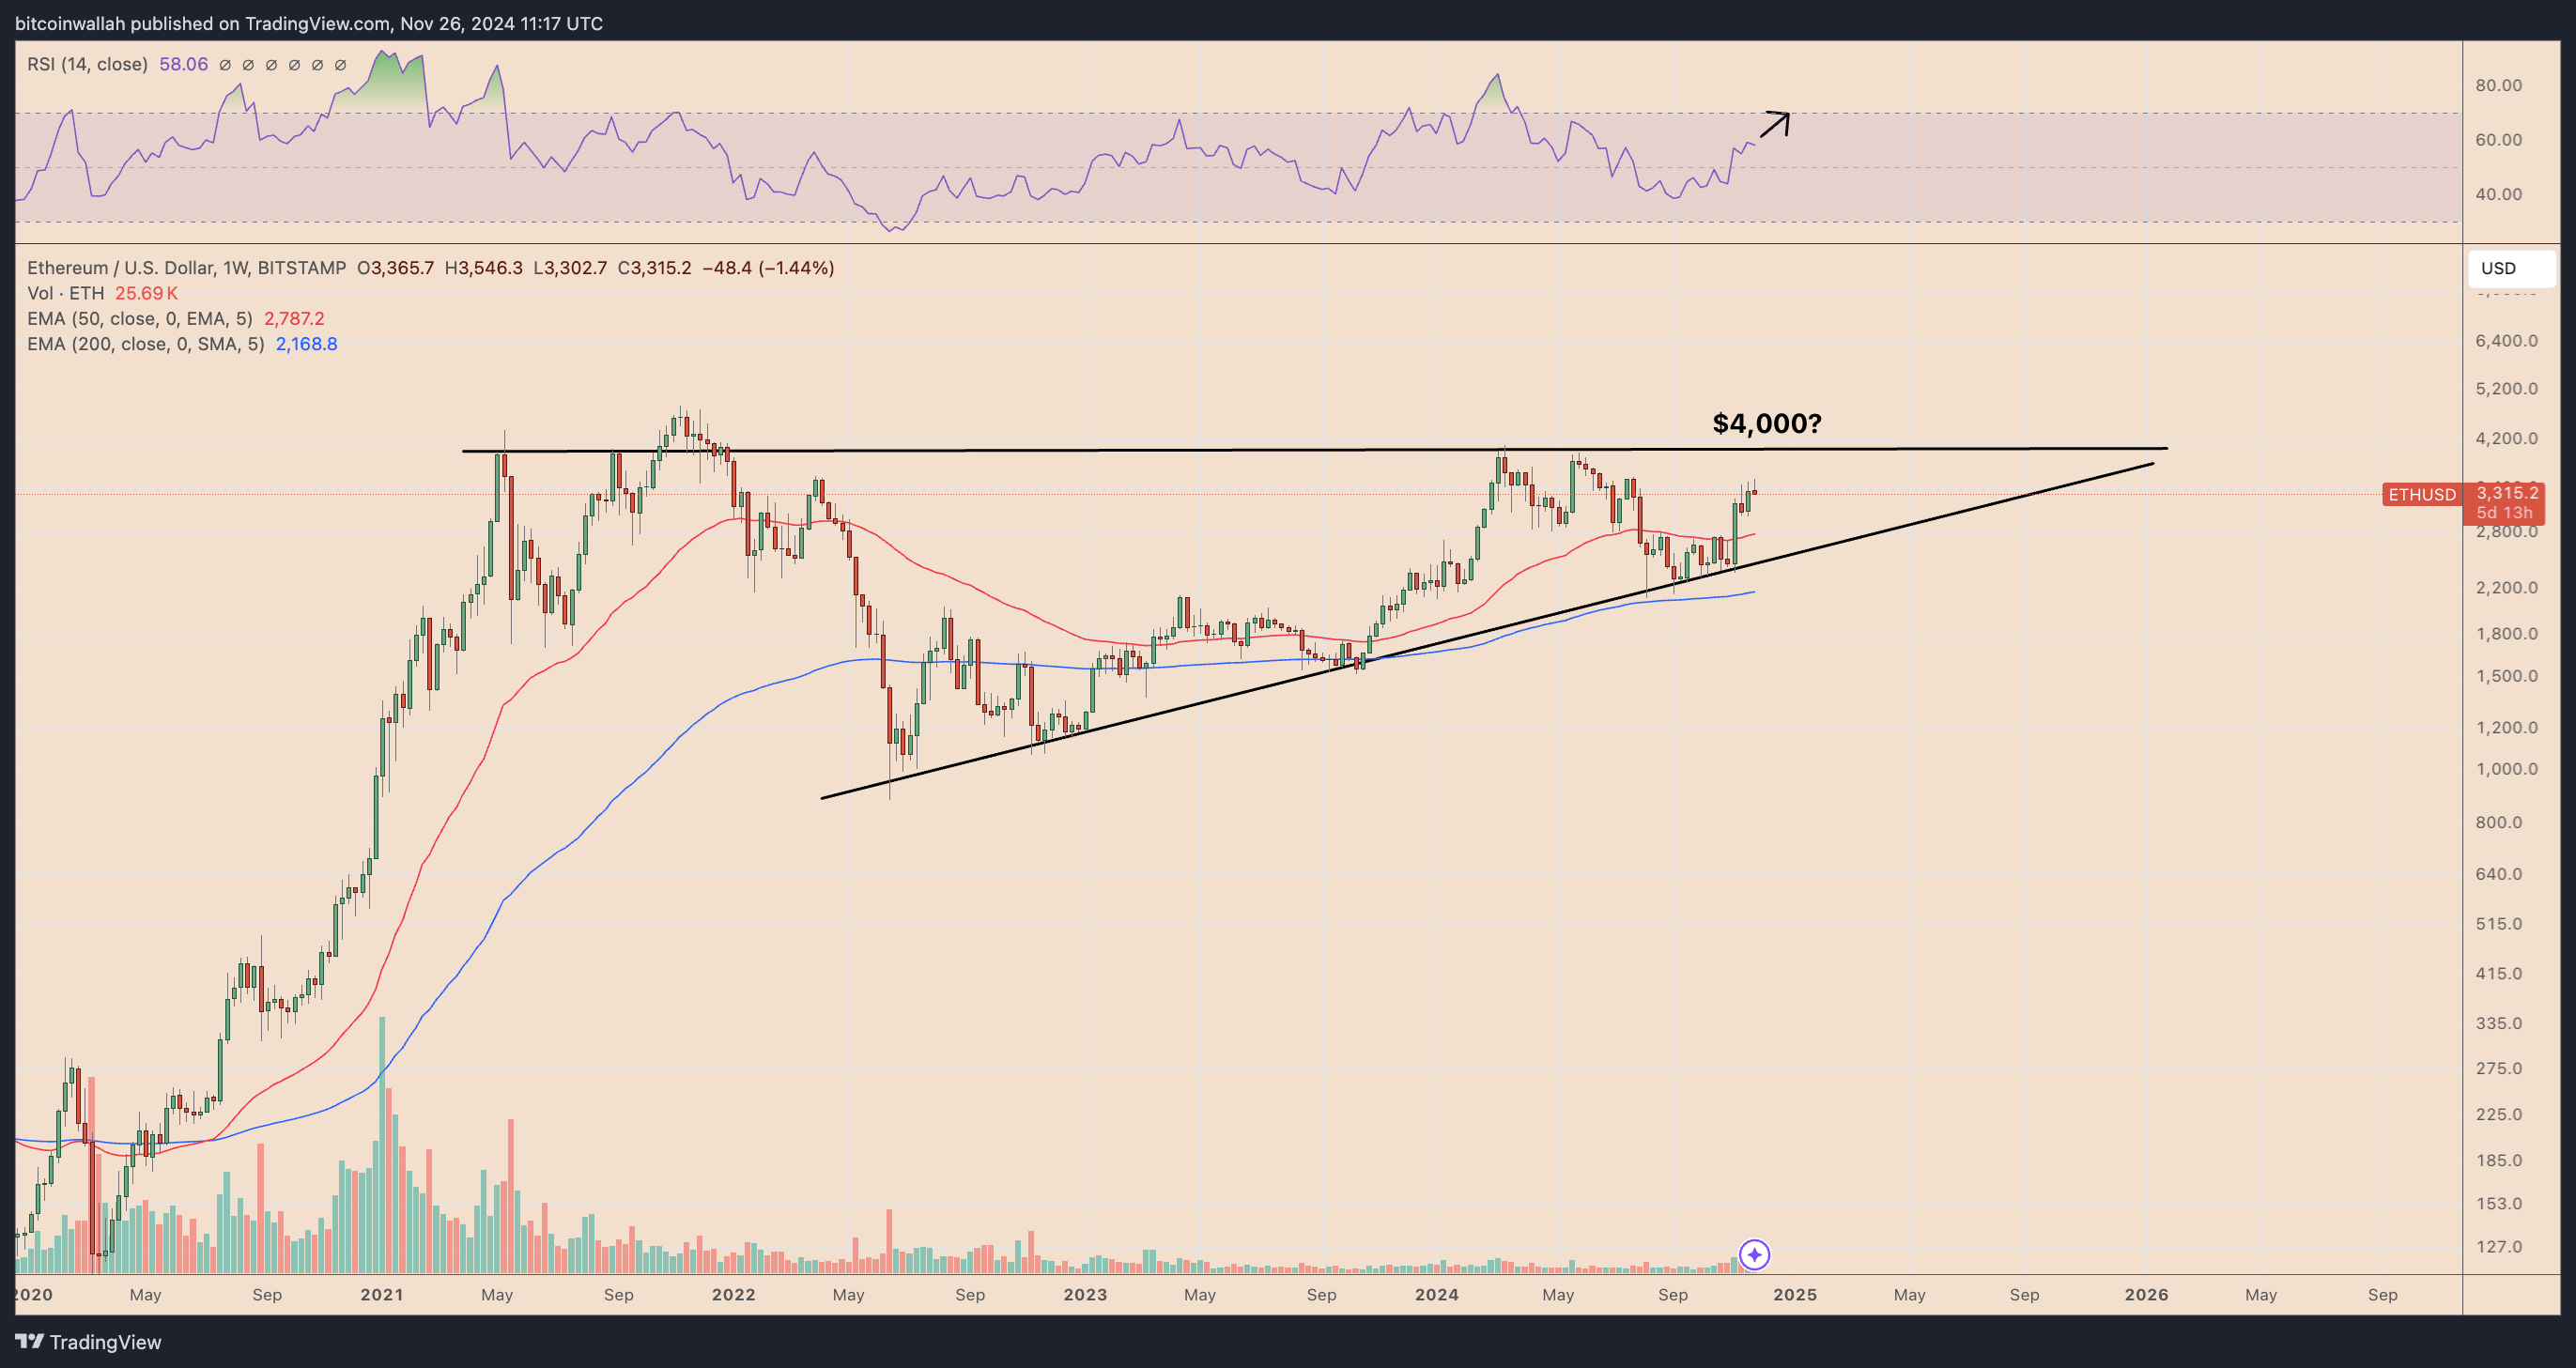
Meanwhile, the weekly RSI at 58.06 shows Ethereum is still within neutral territory, suggesting there is room for further upside before the market reaches overbought conditions.
However, failure to approach $4,000 may lead to a retest of the rising trendline, with support near $3,000, providing another opportunity for accumulation.
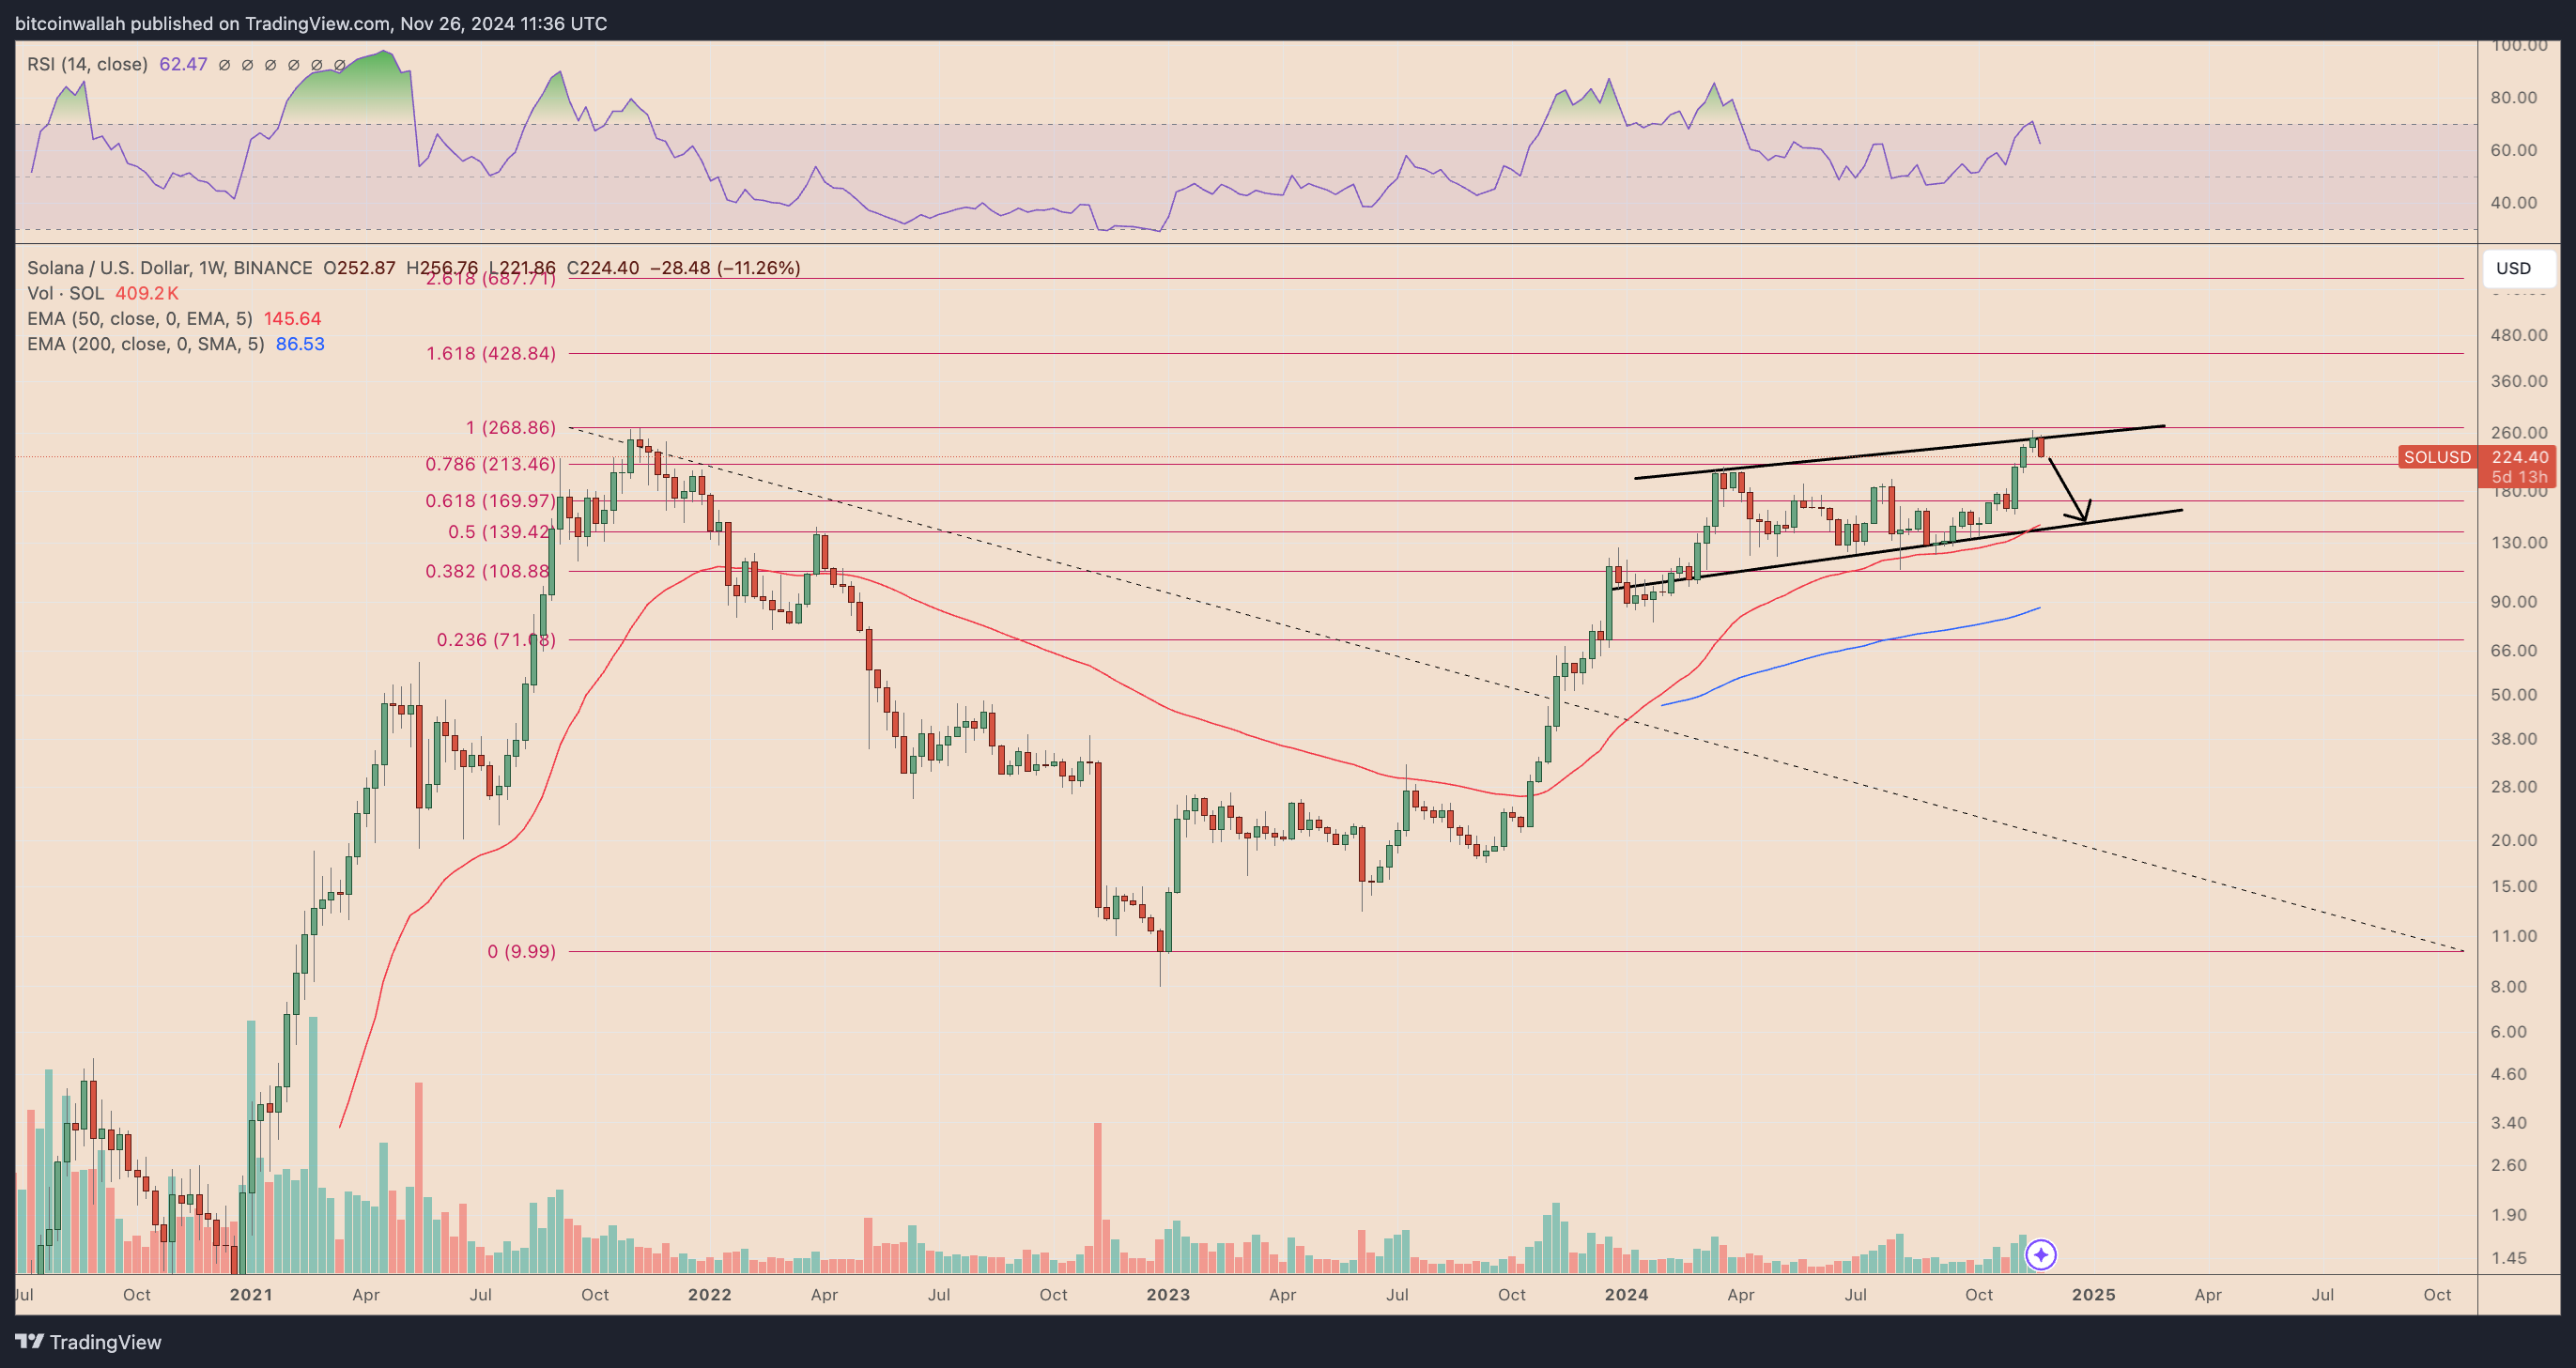
The SOL/USD pair is trading near the upper boundary of a rising channel that has been in play throughout 2024.
A rejection at this resistance level, particularly in the $210–$268 zone, could initiate a pullback toward the channel’s midpoint or lower boundary. This zone aligns closely with the $145 EMA, making it a logical target for bears.