
U.S. Dollar Tested New Lows
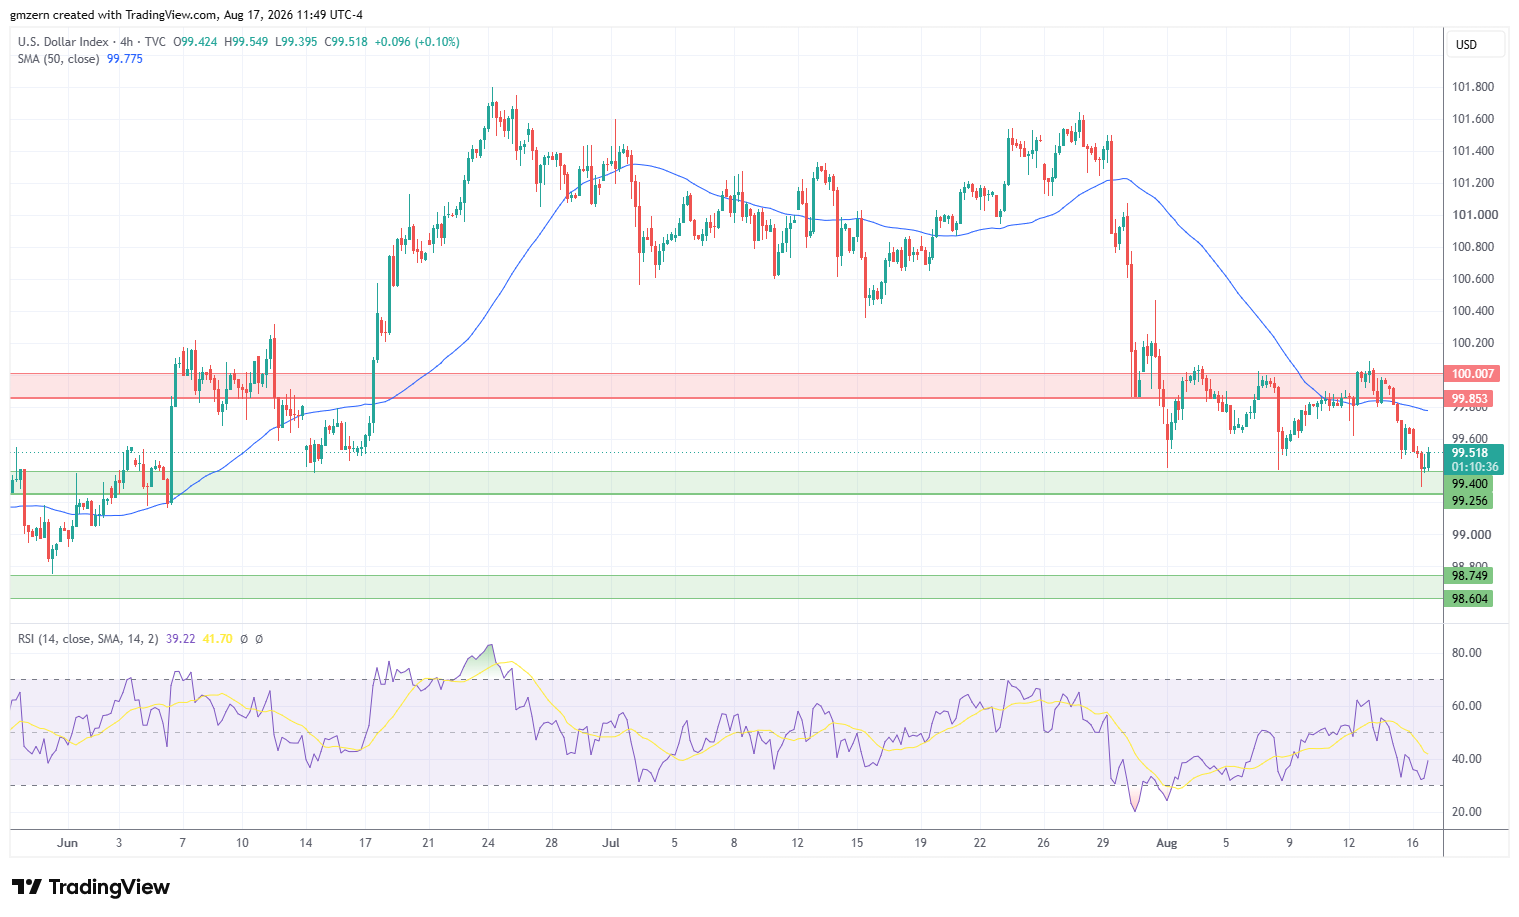
U.S. Dollar Index is losing some ground as traders reduce bets on hawkish Fed. Traders also focus on the NAHB Housing Market Index report for August. The report indicated that NAHB Housing Market Index increased from 34 in July to 35 in August, compared to analyst forecast of 33.
Currently, U.S. Dollar Index is trying to settle below the support level at 99.25 – 99.40. In case U.S. Dollar Index manages to settle below the 99.25 level, it will head towards the next support, which is located in the 98.60 – 98.75 range.

EUR/USD Tests Resistance At 1.1600 – 1.1615
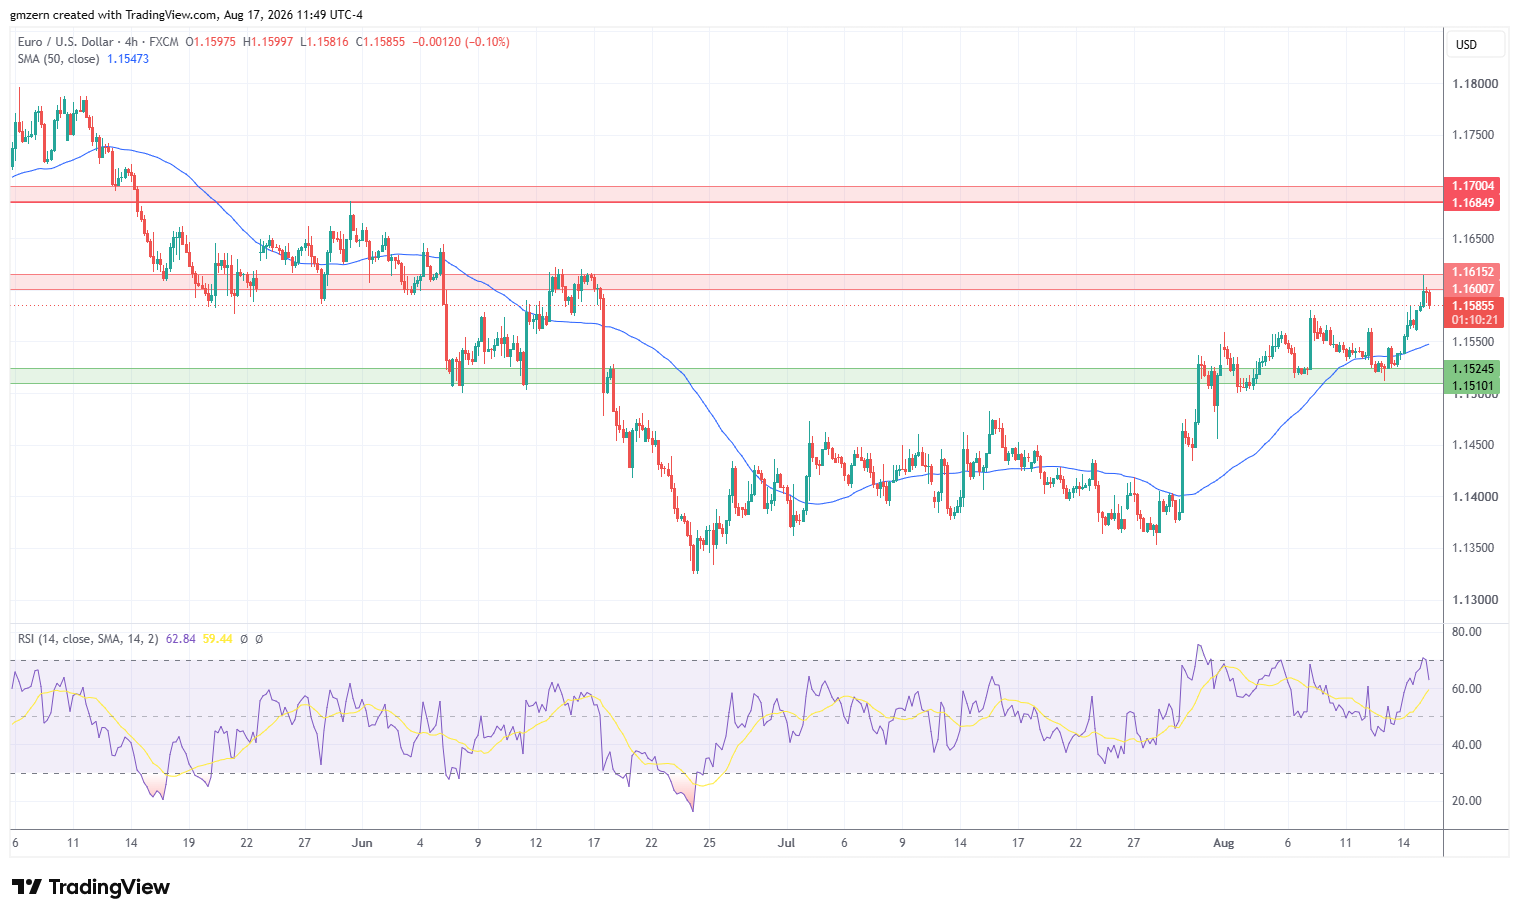
EUR/USD gained ground as traders focused on general weakness of the American currency. Treasury yields were mixed. The yield of 2-year Treasuries pulled back below the 4.17% level, while the yield of 10-year Treasuries settled above 4.70%.
The nearest resistance level for EUR/USD is located in the 1.1600 – 1.1615 range. in case EUR/USD manages to settle above the 1.1615 level, it will head towards the next resistance at 1.1685 – 1.1700. RSI has recently moved back into moderate territory, so there is plenty of room to gain momentum in case the right catalysts emerge.
GBP/USD Tests Multi-Week Highs
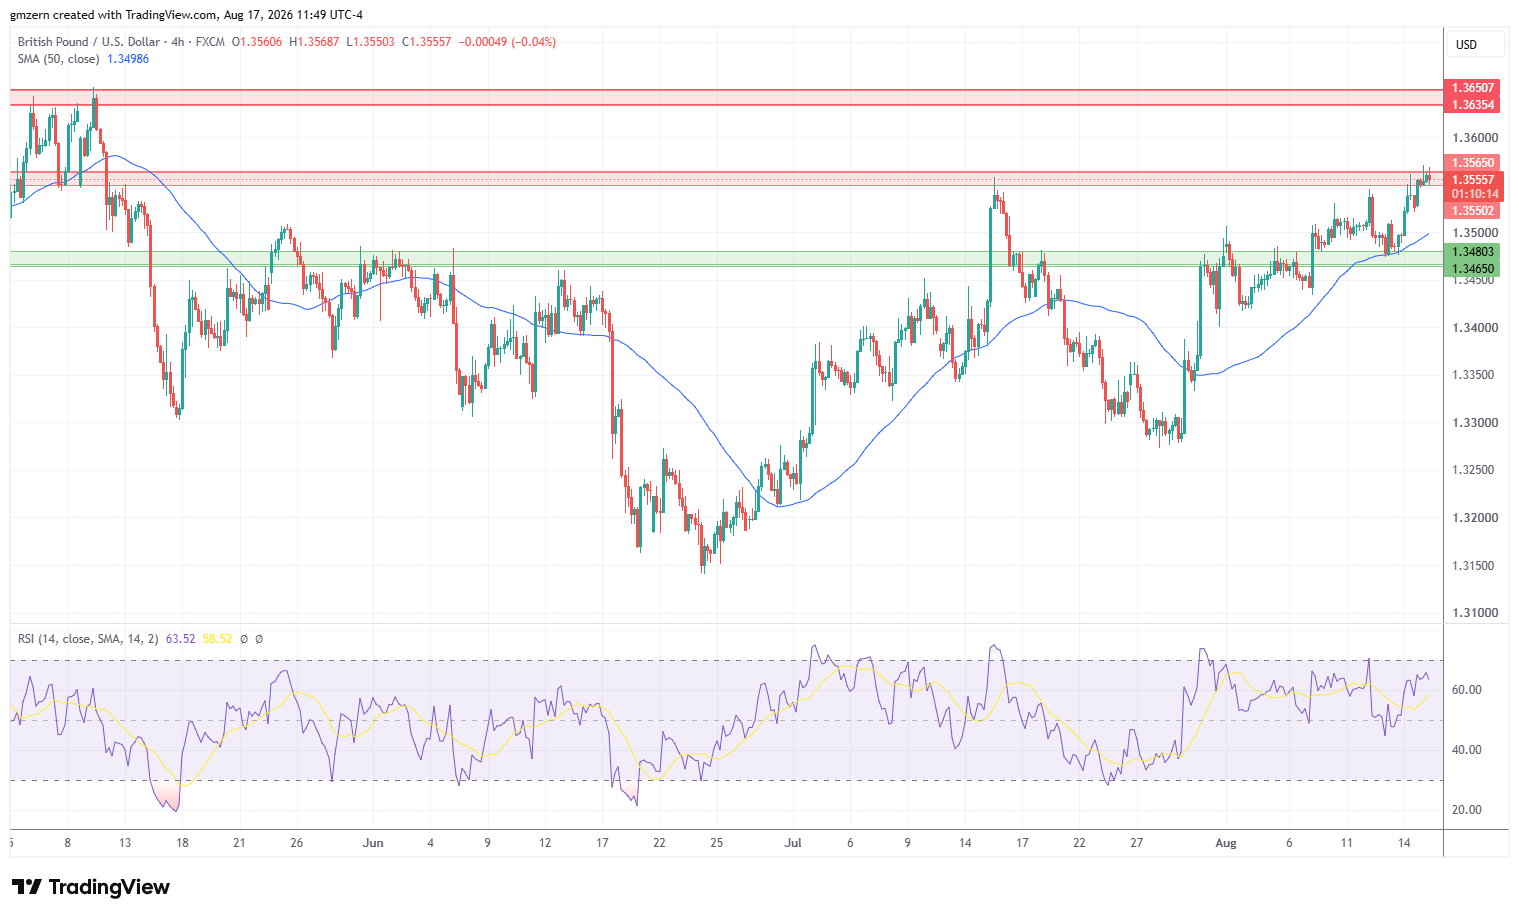
GBP/USD moved higher as traders remained bullish at the start of the week. Traders bet that Fed will leave the federal funds rate unchanged at the next meeting in September.
From the technical point of view, GBP/USD continues its attempts to settle above the resistance level at 1.3550 – 1.3565. If GBP/USD climbs above the 1.3565 level, it will head towards the next resistance, which is located in the 1.3635 – 1.3650 range.
EUR/USD Price Forecast
Every new EUR/USD analysis as it publishes, today's technical signal and key levels, live price — on one page.
See all EUR/USD forecastsUSD/CAD Moves Away From Session Lows As Traders Focus On Canada’s Inflation Data
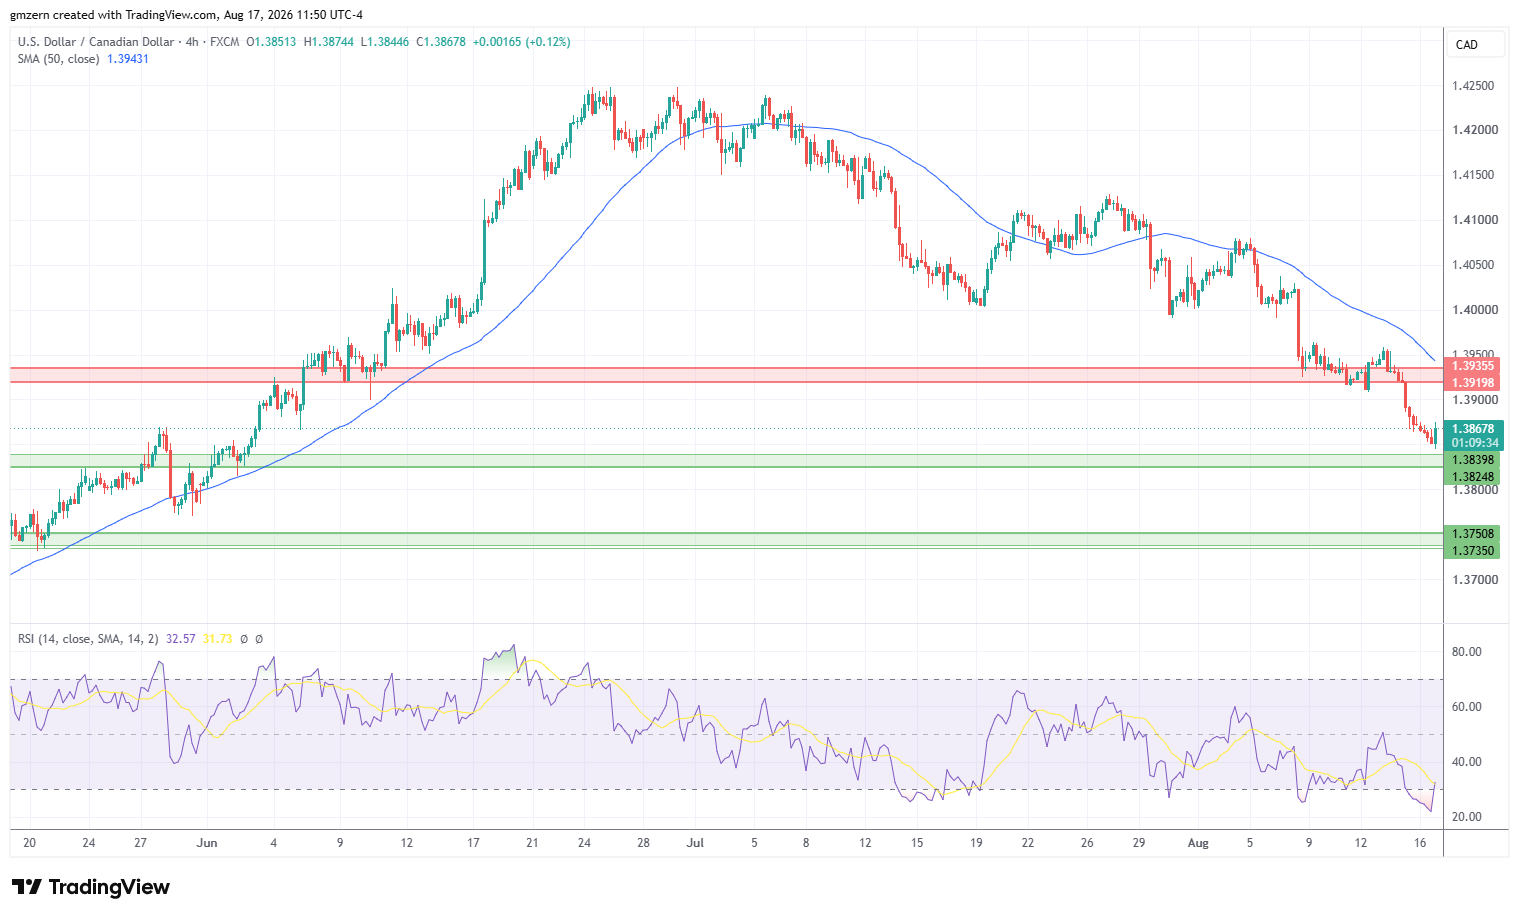
USD/CAD attempts to rebound from multi-week lows as traders react to inflation data from Canada. Inflation Rate increased from 2.8% in June to 3% in July, compared to analyst forecast of 2.9%. Core Inflation Rate grew from 2.1% to 2.3%, compared to analyst consensus of 2.2%.
If USD/CAD settles back above the 1.3880 level, it will head towards the nearest resistance at 1.3920 – 1.3935. On the support side, a successful test of the support at 1.3825 – 1.3840 will open the way to the test of the next support level at 1.3735 – 1.3750.
USD/JPY Is Mostly Flat As Japan’s GDP Growth Rate Misses Estimates
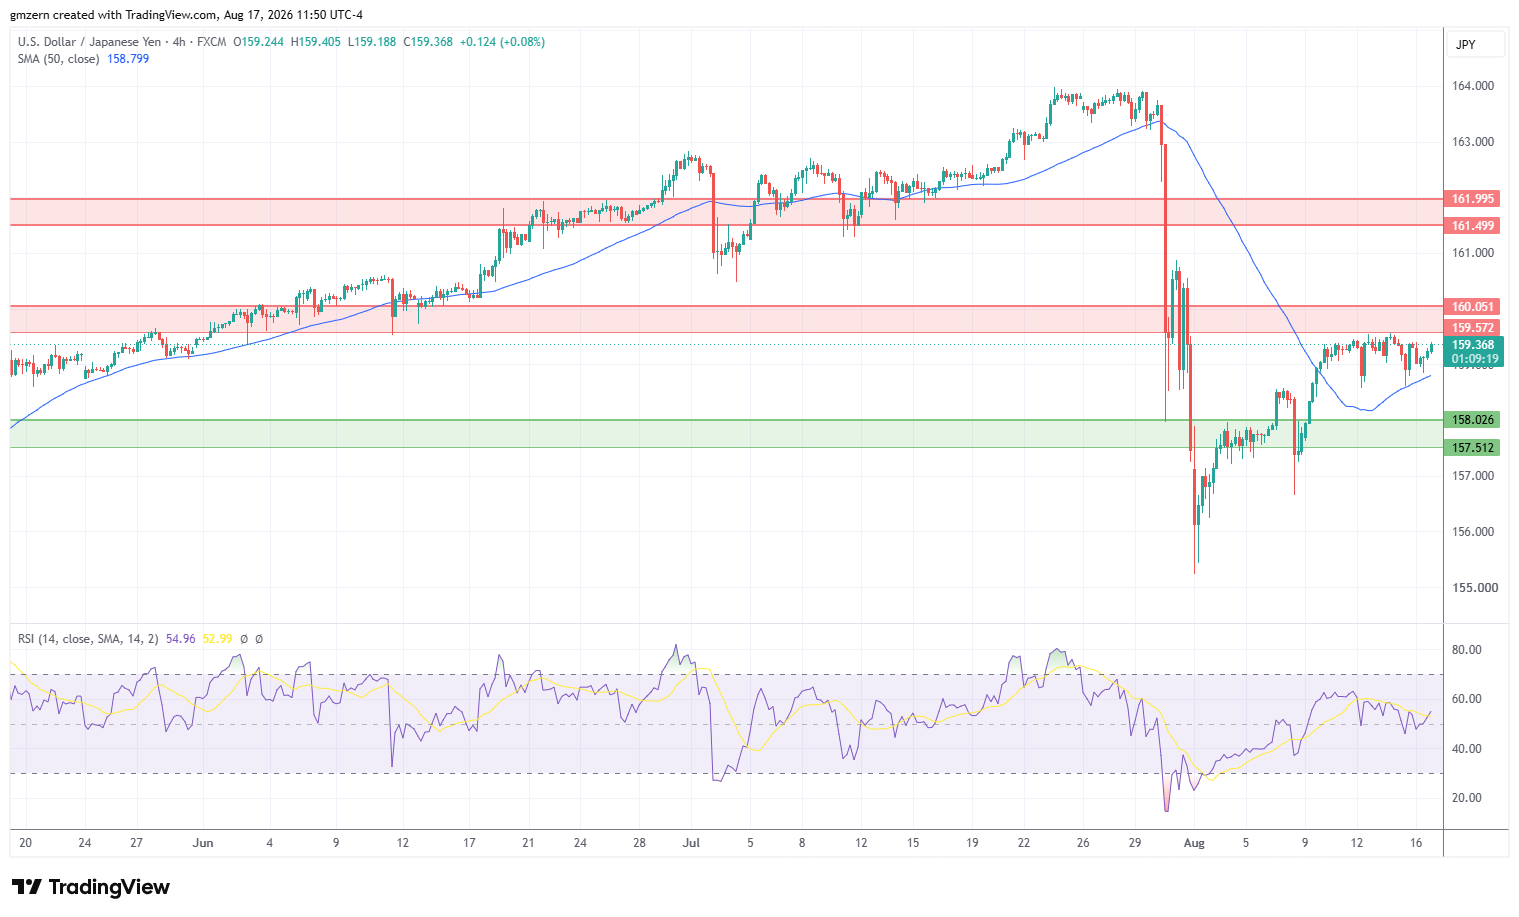
USD/JPY remains stuck below the key resistance level at 159.50 – 160.00 as traders react to Japan’s GDP Growth Rate report. The report showed that GDP Growth Rate was +0.3% in the second quarter, compared to analyst forecast of +0.5%.
Traders are focused on Fed policy outlook and are worried about potential interventions from the BoJ. The Japanese yen is fundamentally weak due to the difference in interest rates, but recent interventions have made traders cautious.
If USD/JPY climbs above the 160.00 level, it will move towards the next resistance level at 161.50 – 162.00. A move above the 162.00 level will push USD/JPY towards the 164.00 level.
On the support side, a move below the 50 MA at 158.79 will open the way to the test of the nearest support level at 157.50 – 158.00.
If you’d like to know more about how to trade forex, please visit our educational area.