Nasdaq 100 Technical Analysis
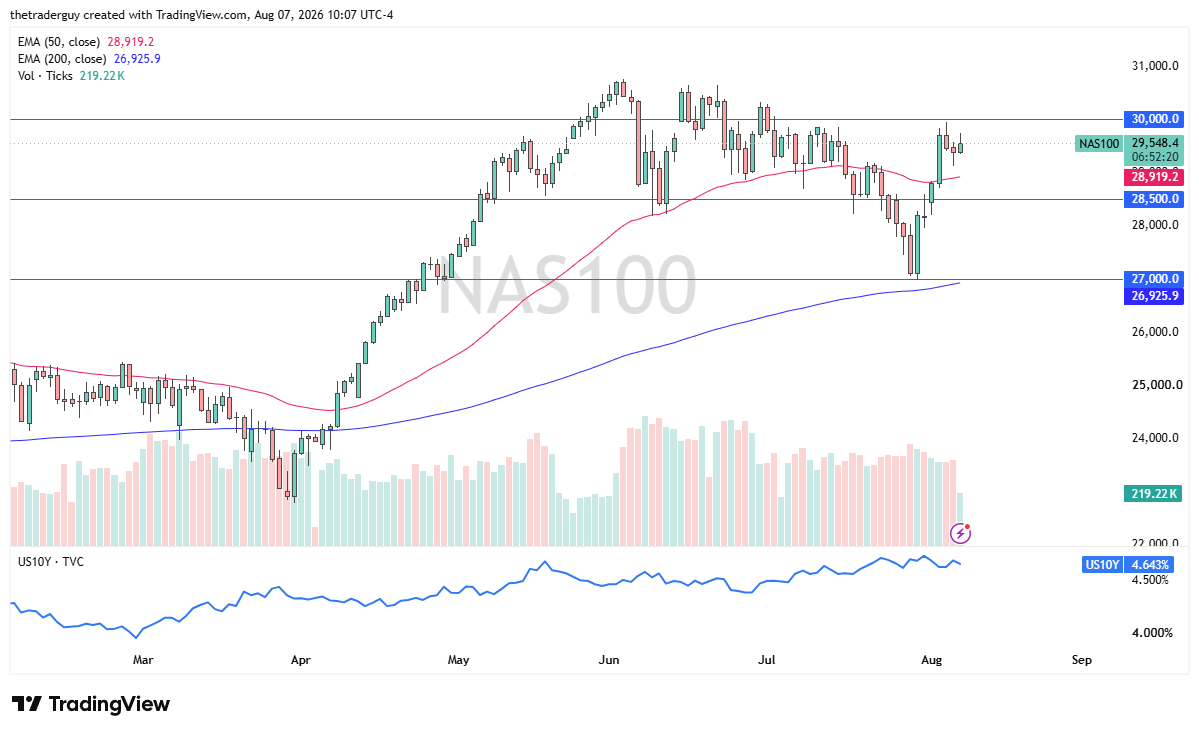
The Nasdaq 100 rallied a bit during the early part of the trading session, but gave back some of the gains as the jobs numbers came out weaker than anticipated. In fact, it was a loss of jobs, which was quite a bit different than expected. Ultimately, this is a market that, given enough time, will have to come to grips with what the Federal Reserve is going to do. And, unfortunately, that is a muddy picture with the war in the Middle East and, now, weaker economic numbers coming out all across the board in the U.S., with the exception of manufacturing PMI, which was hotter than anticipated.

Dow Jones 30 Technical Analysis
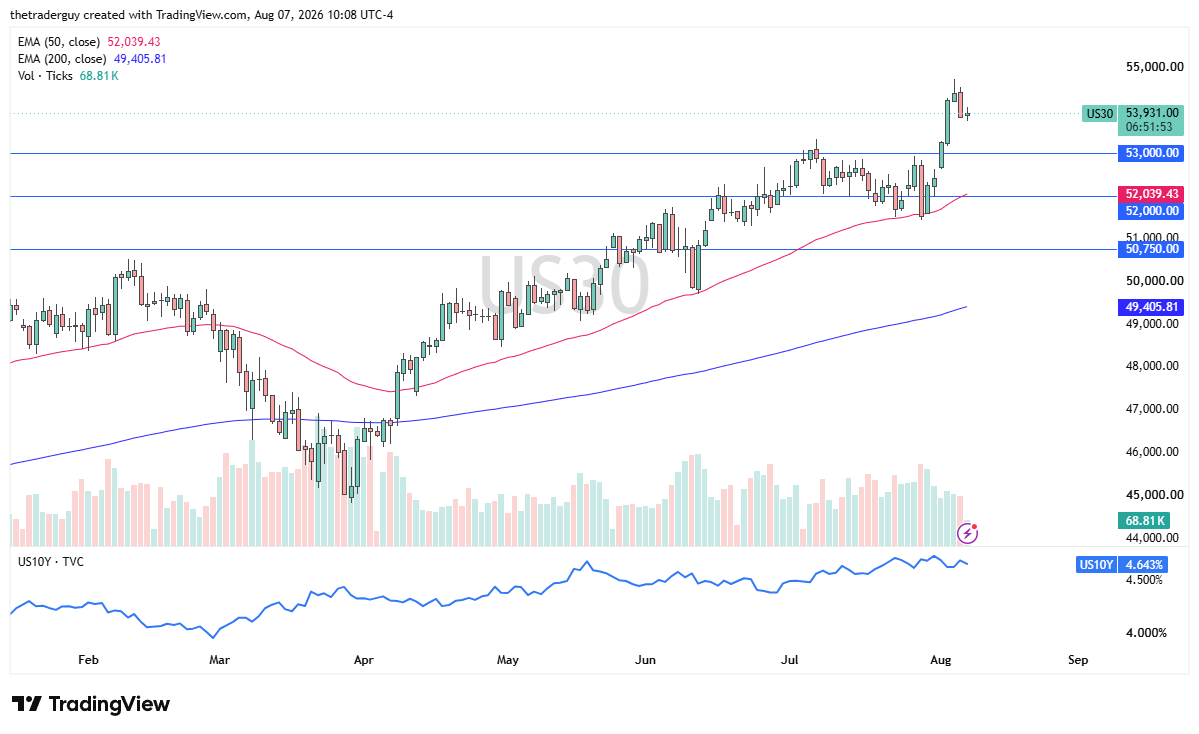
The Dow Jones 30 finds itself just hanging around. It has been both positive and negative during the session. It looks very much like a market that is trying to sort out things and which direction to go. But the other thing that I am paying attention to is the fact that it’s Friday and we’re heading into the weekend. And, the weekend brings a lot of uncertainty.
With that being the case, it’s very likely that a lot of traders are out there just simply sitting on the sidelines trying to figure out exactly what to do. We have broken out to the upside. It is a strong-looking chart. I certainly don’t have any interest in shorting, but I also recognize putting a huge position on a Friday session might be a tall order in this current environment that we find ourselves in.
S&P 500 Technical Analysis
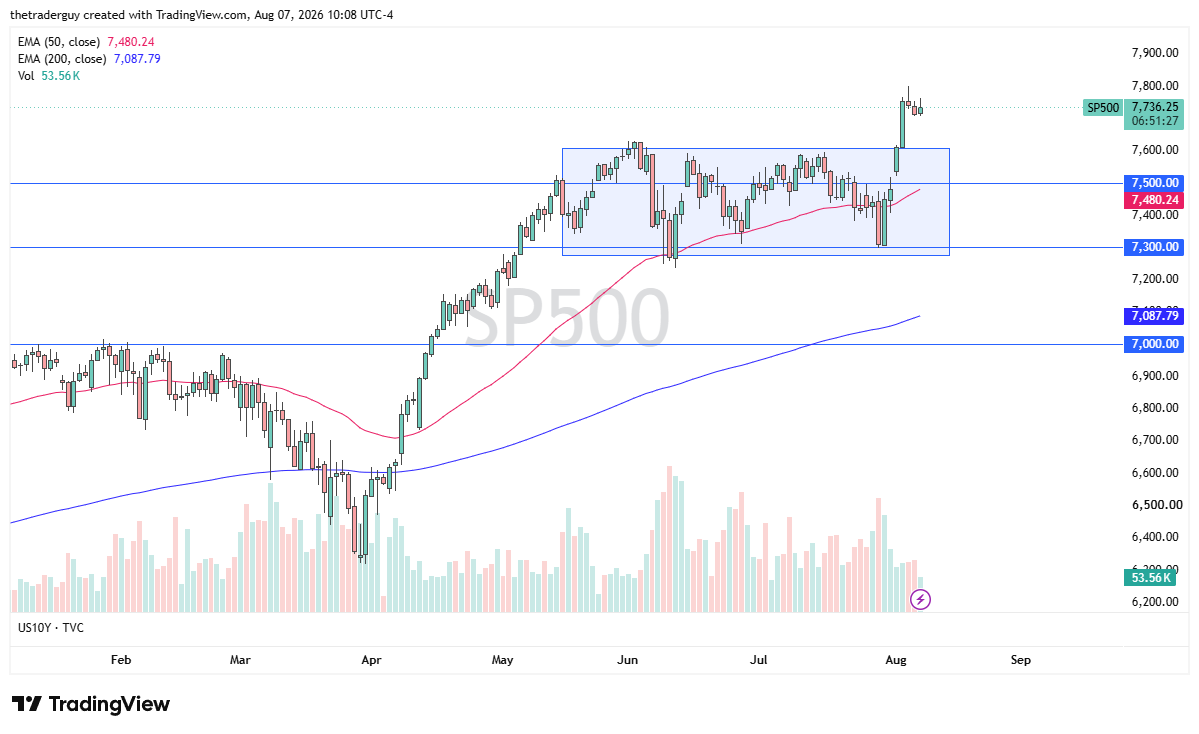
The S&P 500 initially spiked higher, but looks a little limp at the moment. We are forming something akin to a bullish flag. We’ll just have to wait and see, but, ultimately, I think you have to look at this as a market that will eventually try to resolve the digestion of this big move to the upside. Sometimes that means a pullback; sometimes that means sideways action. The 7,600 level, to me, looks like it is probably supportive, as it had previously been resistant. Even though this isn’t exactly the greatest candlestick, I still look at this and see an uptrend.
If you’d like to know more about technical analysis and how traders use it, please visit our educational area.