
US Dollar Rises as Gold Holds Steady Amid Key Data
The US Dollar Index (DXY) rose 0.06% to 108.14 on Thursday, bolstered by lower-than-expected unemployment claims of 219K versus the forecast of 223K, underscoring labor market resilience. Gold held steady at $2,633 per ounce, with only a marginal 0.03% dip, reflecting cautious sentiment ahead of critical economic data.
Friday’s reports, including the Goods Trade Balance (-$101.3B forecast) and Prelim Wholesale Inventories (0.1% forecast), could influence market direction. These figures will likely shape expectations for both the dollar’s strength and gold’s safe-haven demand in the near term.

US Dollar Index (DXY) – Technical Analysis
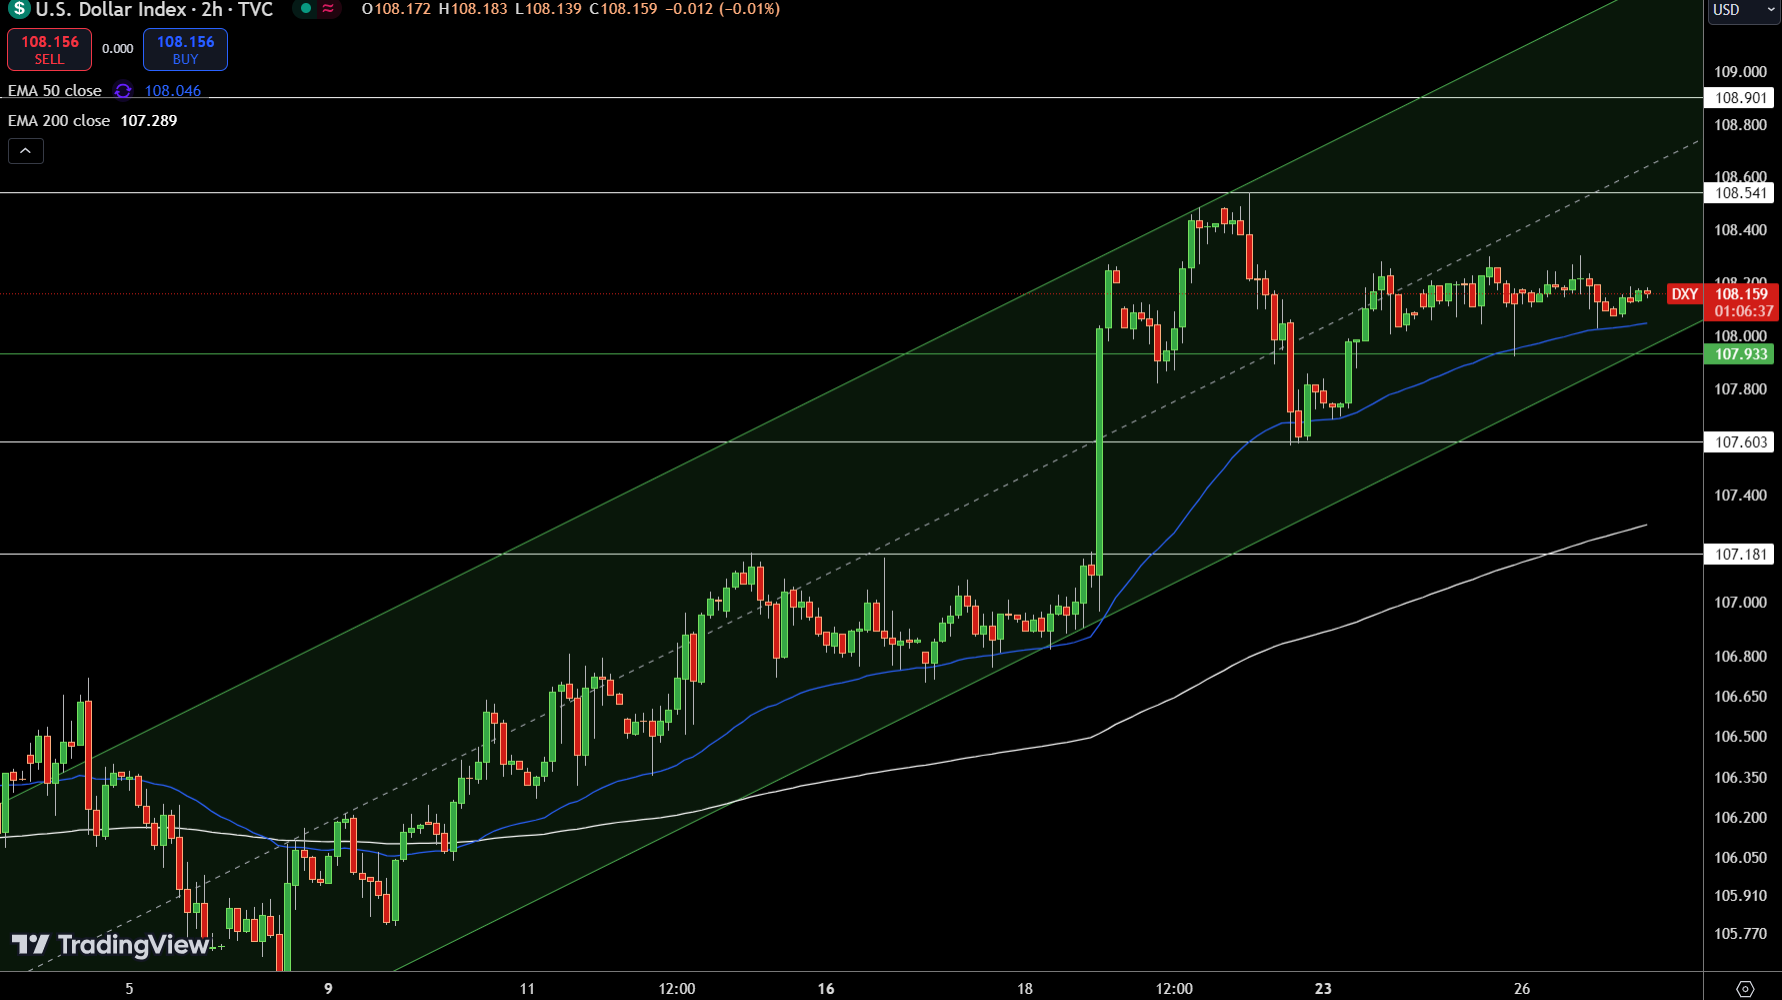
The Dollar Index (DXY) is trading at 108.145, up 0.06%, maintaining its bullish momentum above the pivot point at 107.93. The 4-hour chart highlights an upward channel, signaling a continued positive bias. The 50-day EMA at 108.05 provides near-term support, while the 200-day EMA at 107.29 underpins the broader trend.
Immediate resistance stands at 108.54, with further upside potential to 108.90. On the downside, support levels are at 107.60 and 107.18. A sustained break below 107.93 could shift momentum sharply bearish.
Traders should monitor the 108.54 resistance for confirmation of extended bullish moves and closely watch the 107.93 pivot to gauge any downside risks.
GOLD Technical Analysis
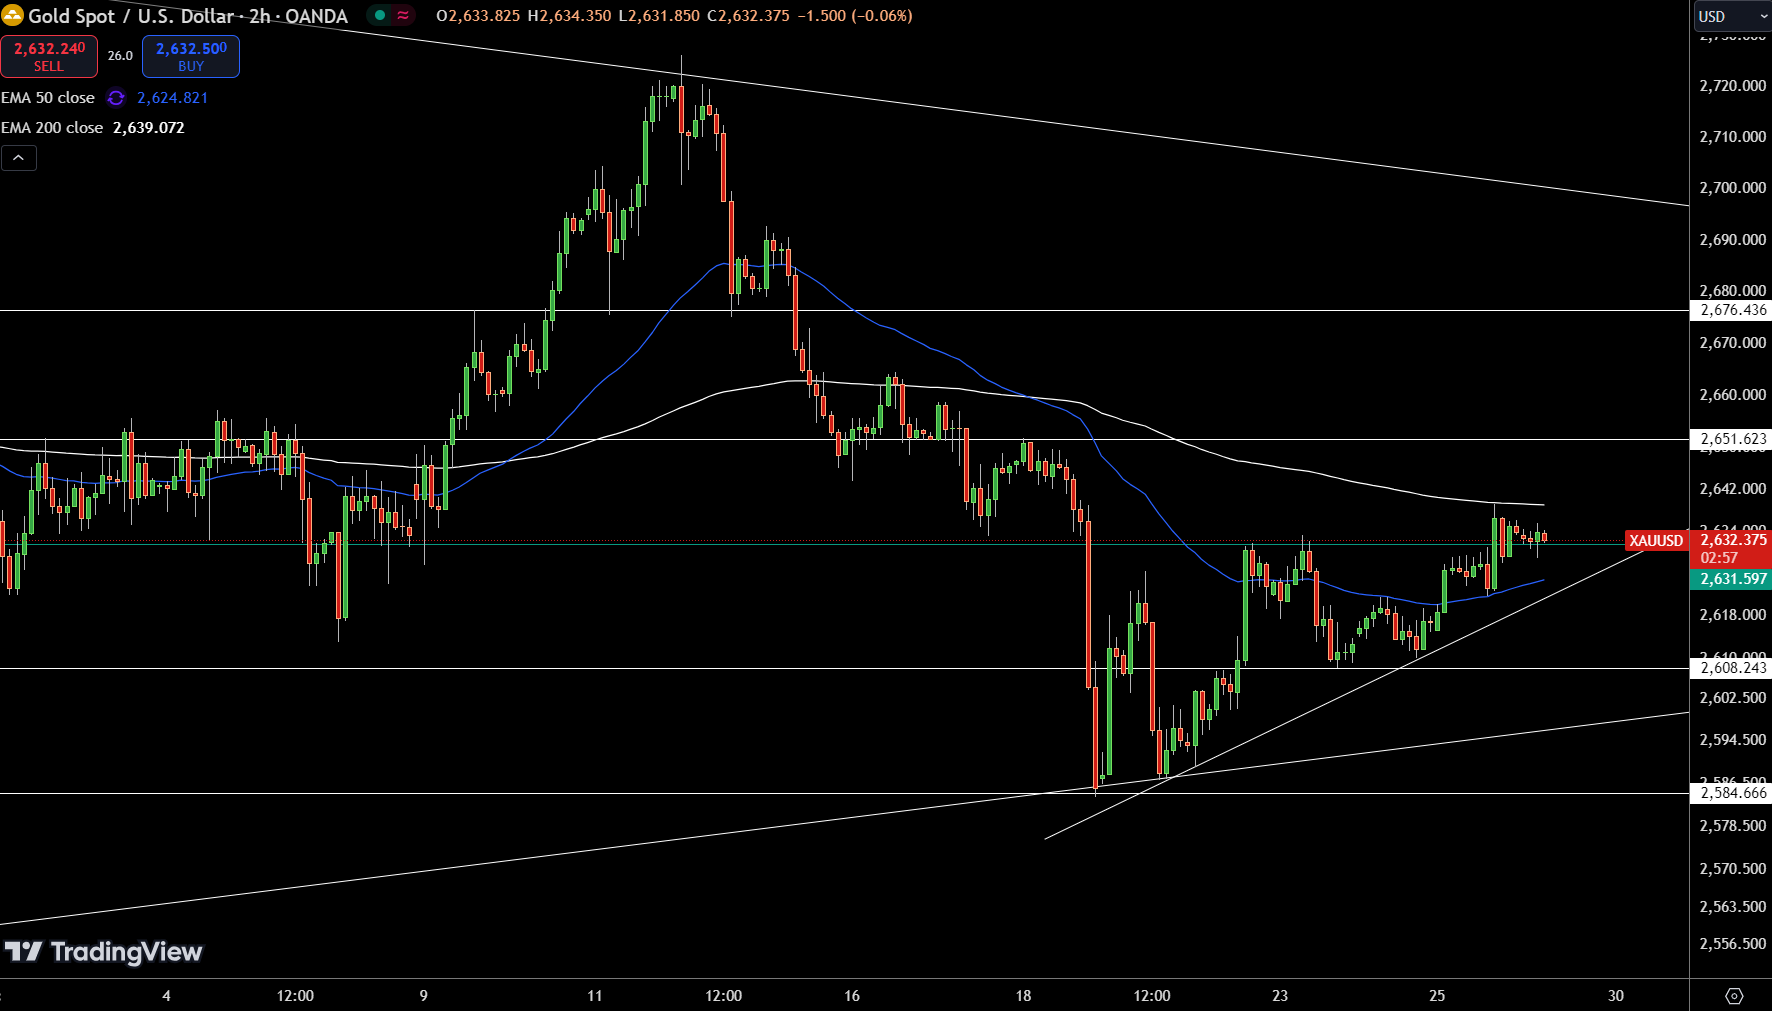
Gold (XAU/USD) is trading at $2,633.03, down 0.03%, consolidating above its pivot at $2,631.59. The 50-day EMA at $2,624.82 offers near-term support, while the 200-day EMA at $2,639.07 signals broader consolidation.
Gold Price Forecast
Every new Gold analysis as it publishes, today's technical signal and key levels, live price — on one page.
See all Gold forecastsImmediate resistance is at $2,651.62, with potential to rise toward $2,676.43. Support lies at $2,608.24, with a break below targeting $2,584.66.
Gold’s outlook remains cautiously optimistic above $2,630, but a breach could trigger bearish momentum.
GBP/USD Technical Analysis
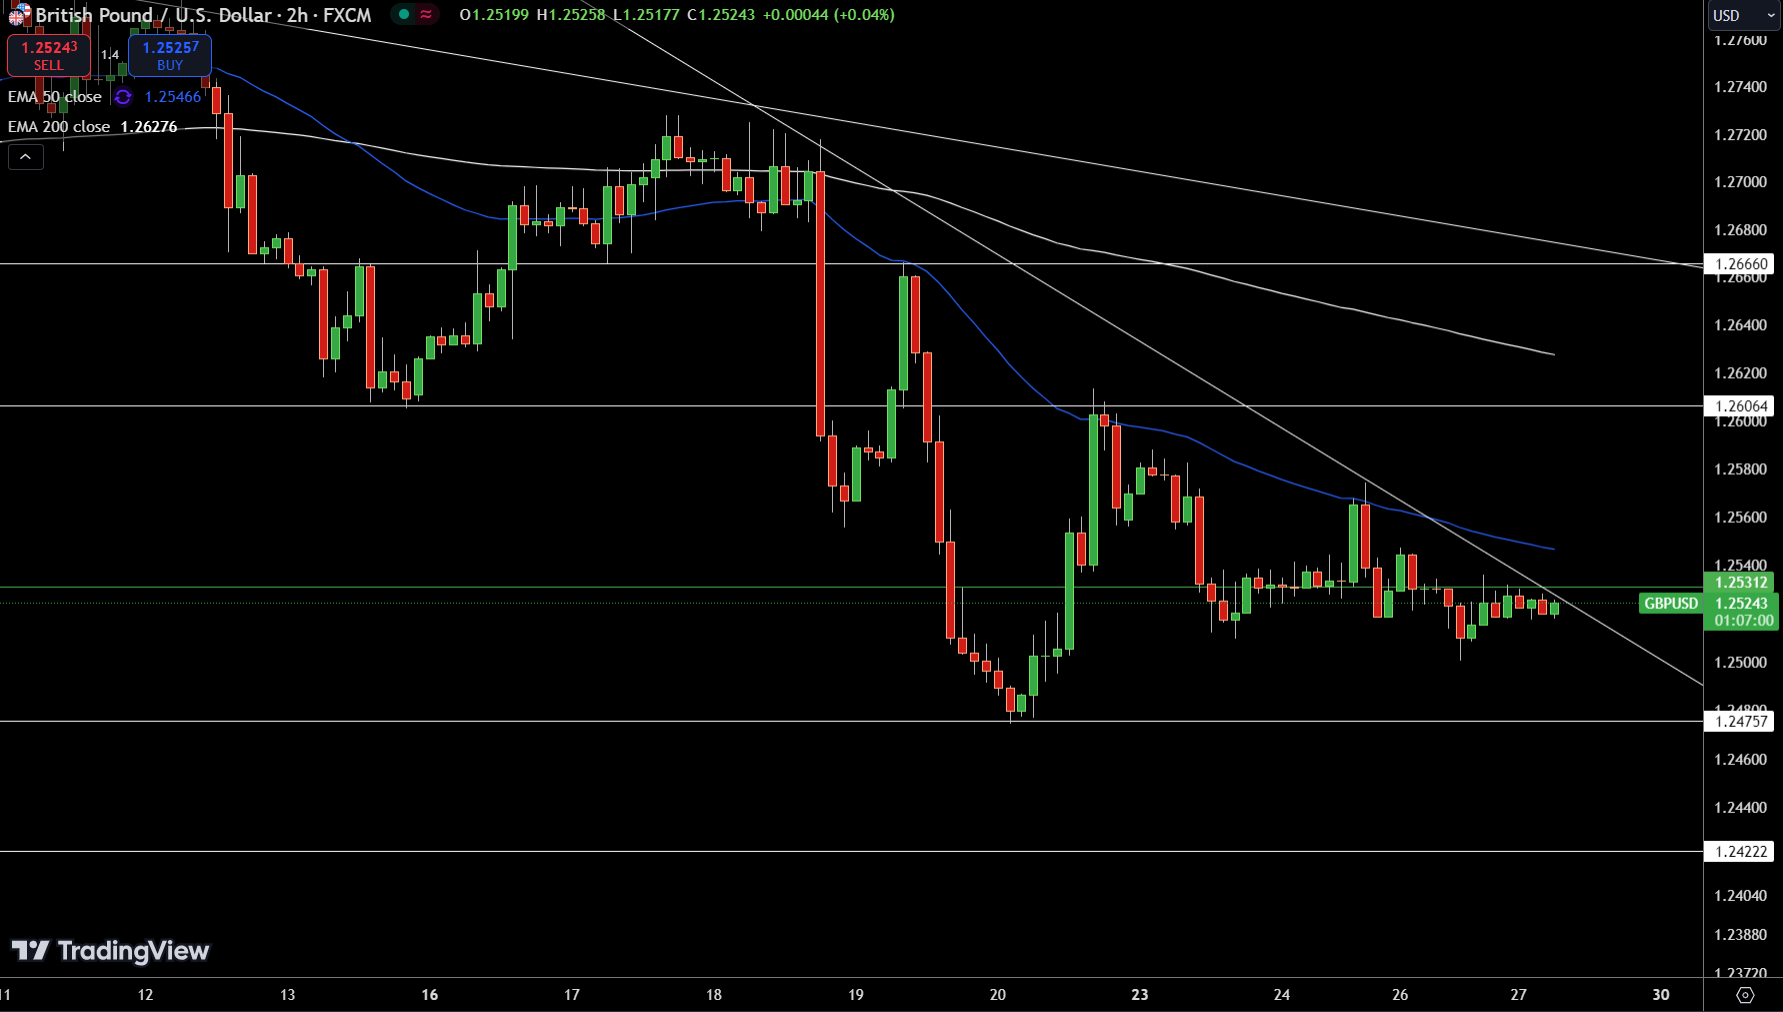
The GBP/USD is trading at 1.25239, up 0.04%, as it hovers near the pivot point at 1.25312. A downward trendline continues to cap gains, presenting a key resistance level at 1.25312. Breaking above this could open the door to higher targets at 1.26064 and 1.26660.
However, if the pair fails to sustain above the pivot, immediate support is positioned at 1.24757, with further downside likely toward 1.24222.
The 50-day EMA at 1.25466 and the 200-day EMA at 1.26276 highlight ongoing bearish pressure. A decisive move above 1.25312 could shift sentiment to bullish, but the broader outlook remains cautious below this level.
EUR/USD Technical Forecast
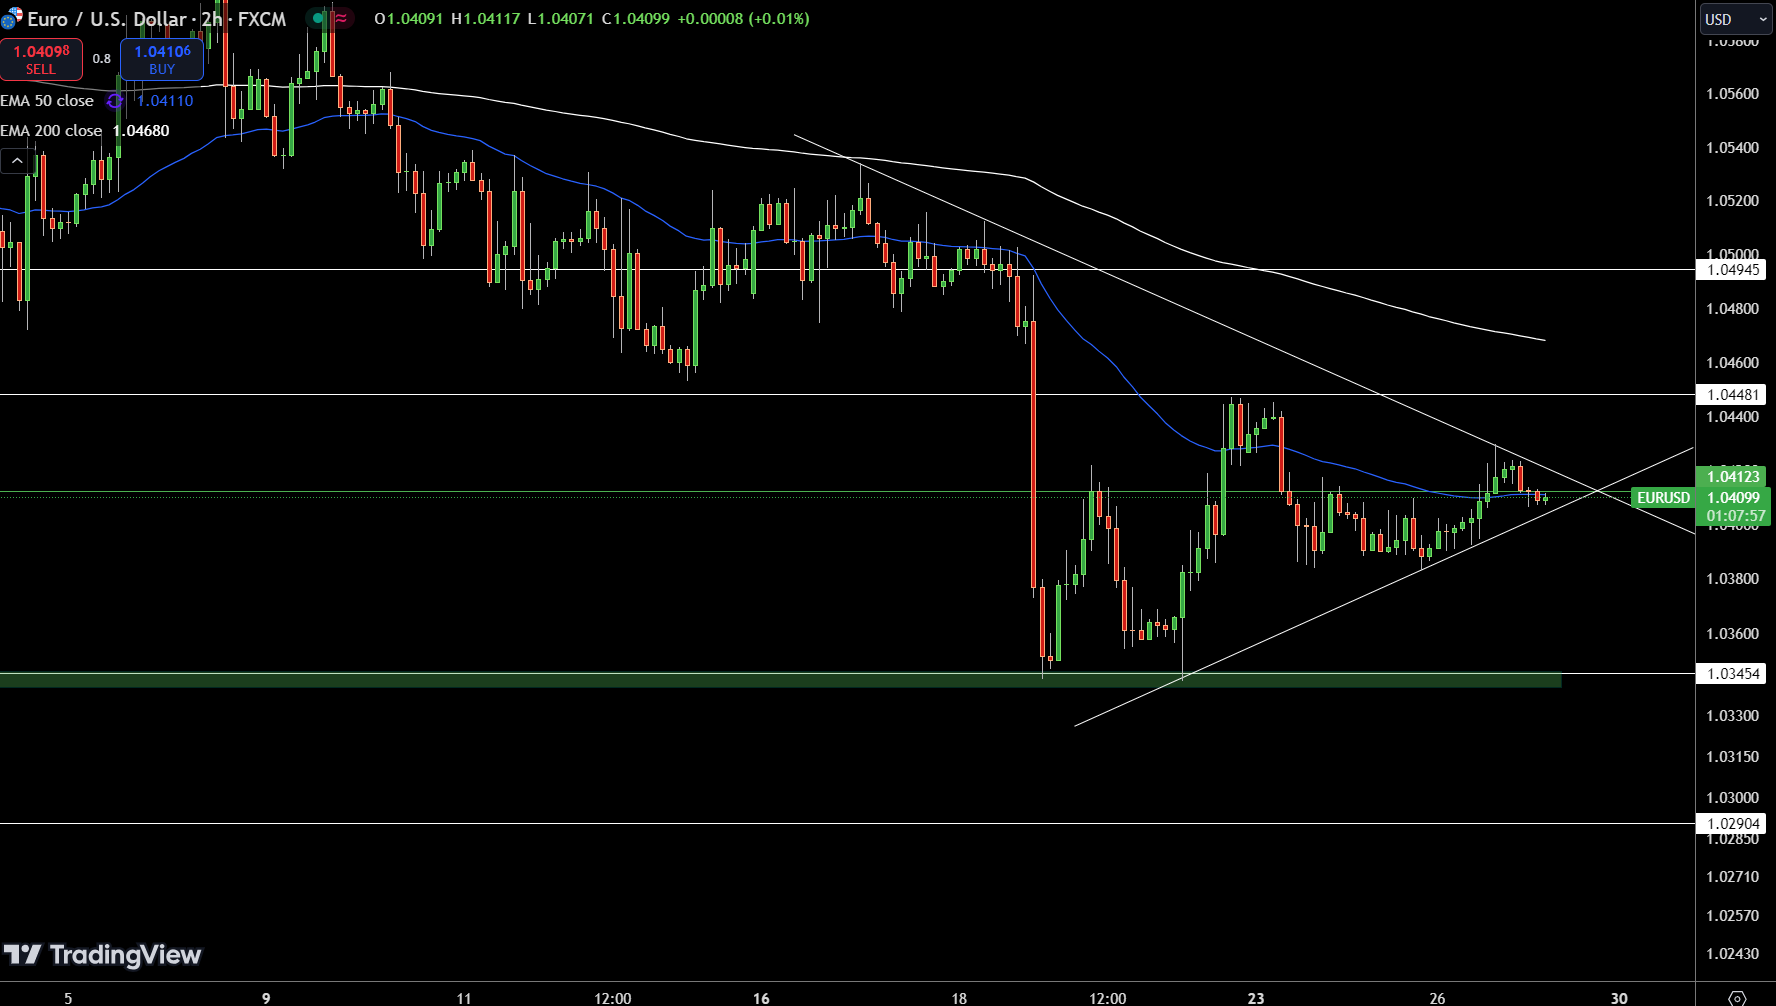
The EUR/USD is trading at 1.04112, down 0.09%, as it struggles below the pivot point at 1.04123. A downward trendline continues to act as a strong resistance, capping upward momentum near this level. Immediate resistance stands at 1.04481, followed by a more significant hurdle at 1.04945
. On the downside, support levels are observed at 1.03454 and 1.02904, with the potential for further declines if bearish momentum builds.
The 50-day EMA at 1.04110 aligns closely with current levels, signaling near-term consolidation, while the 200-day EMA at 1.04680 underscores a broader bearish bias. A break above 1.04123 could shift sentiment to bullish, while failure to hold this level may encourage further selling pressure.