US Indices Analysis
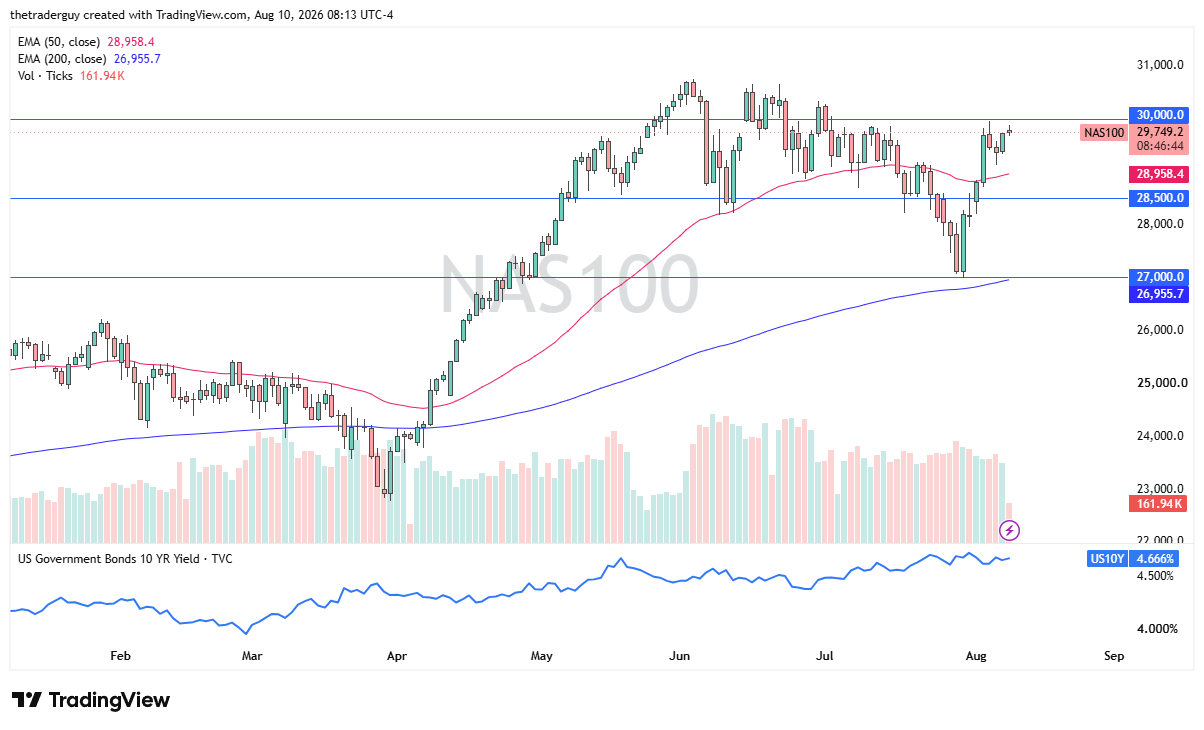
The Nasdaq 100 rallied slightly during pre-market trading on Monday, but has given back some of those gains as the 30,000 level above looms large. The question is, will that be enough psychological barrier to keep the market down, or can we break out to the upside? We have been very positive as of late. The last couple of days have been more about consolidation. That makes a bit of sense because these big figures can attract a lot of action.
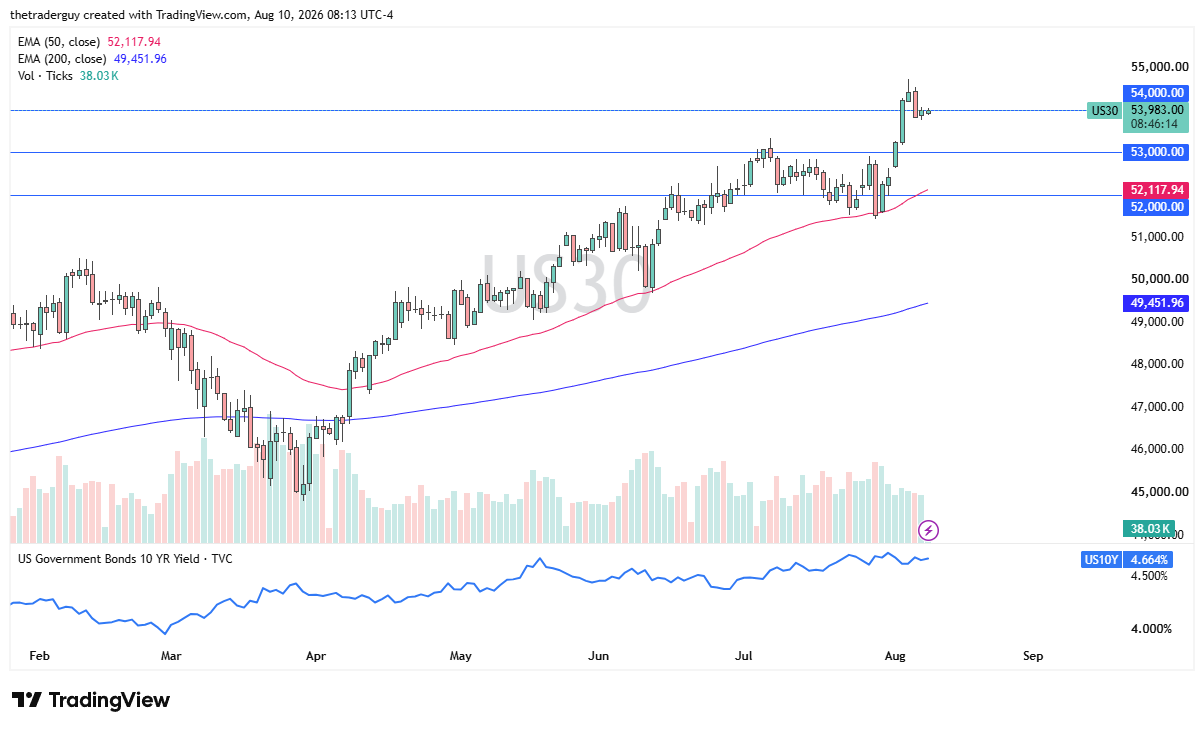
The Dow Jones 30 is hanging around the 54,000 level, and we have recently pulled back, and now it looks like we’re trying to stabilize here. If this market stabilizes, then it gives traders some time to get comfortable with these elevated levels. The Dow Jones 30 has been very positive for a while, so it remains bullish longer term. In the short term, it looks fairly quiet, and perhaps we’re looking for the next momentum-building event.

S&P 500 Consolidation and Rate Sensitivity
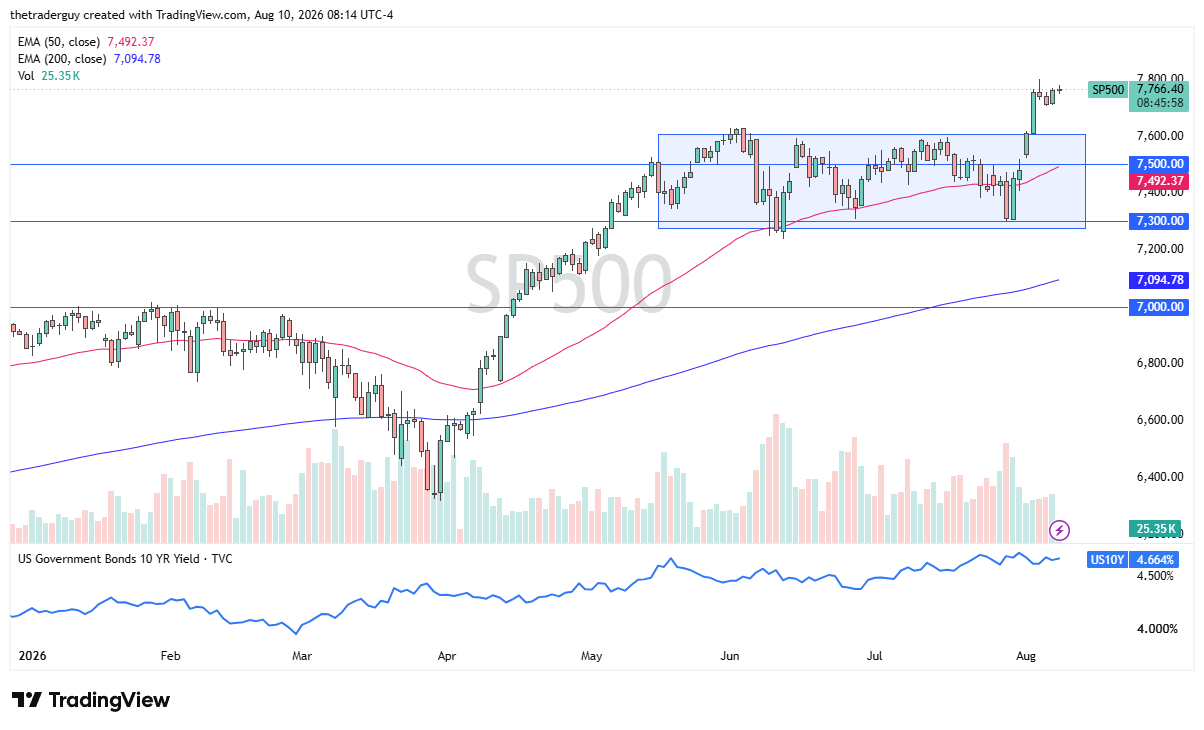
The S&P 500 is fairly quiet as well, as the 7,800 level looks to be a bit of a barrier. We had recently shot straight up in the air, and now we’ve spent some time consolidating. It makes a certain amount of sense that this is a market that may have to burn off some of that excess froth.
Dealing with the jobs number coming out so poorly on Friday will be interesting. We’ll see how that influences the market. On Friday, it seemed positive. We’ll see if that continues going forward. Rates are still a little bit high, but the market has decidedly broken out of the previous consolidation area, looking bullish.
If you’d like to know more about chart patterns and how to trade them, please visit our educational area.