NASDAQ 100 Technical Analysis
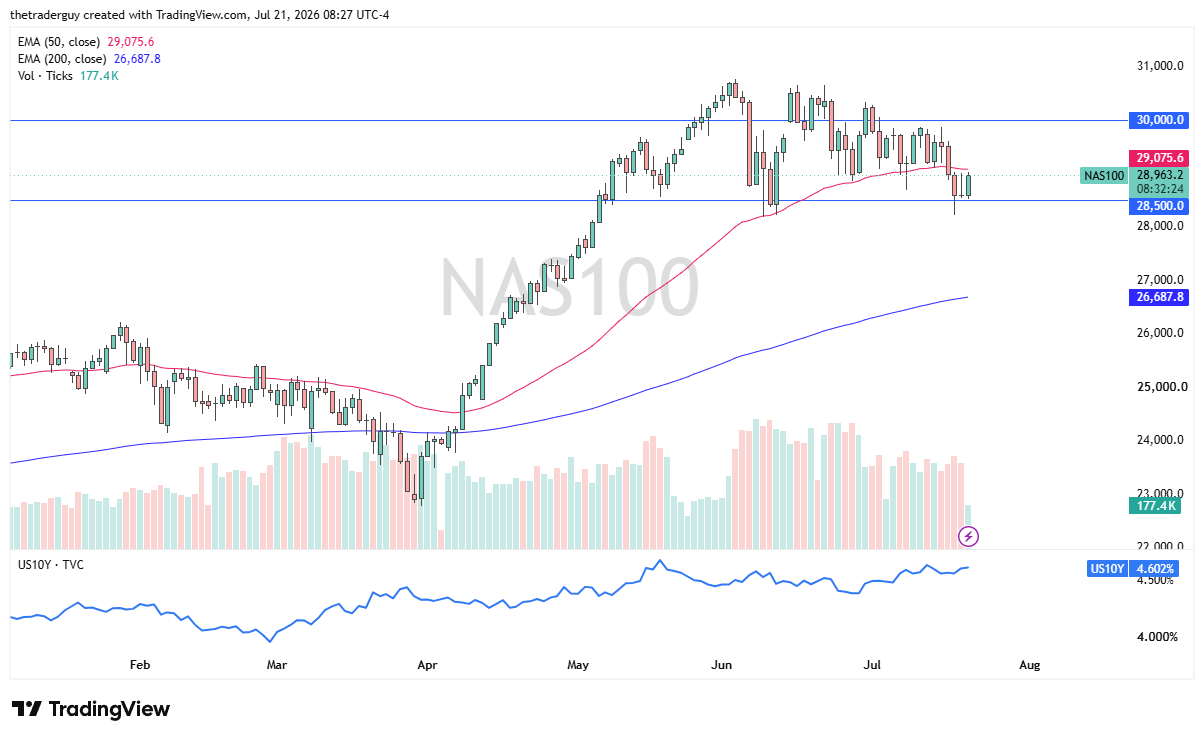
The Nasdaq 100 has shown itself to be a resilient index in the early part of Tuesday trading, as we have bounced from that crucial 28,500 level. This is a market that I think continues to be very noisy, but it looks like it is trying to defend the overall consolidation area. The 30,000 level above has been an area of significant resistance, and now it looks like we are just trying to reenter that area that we had spent so much time in over the last several months. It is earnings season, so that will have its influence as well.

Dow Jones 30 Technical Analysis
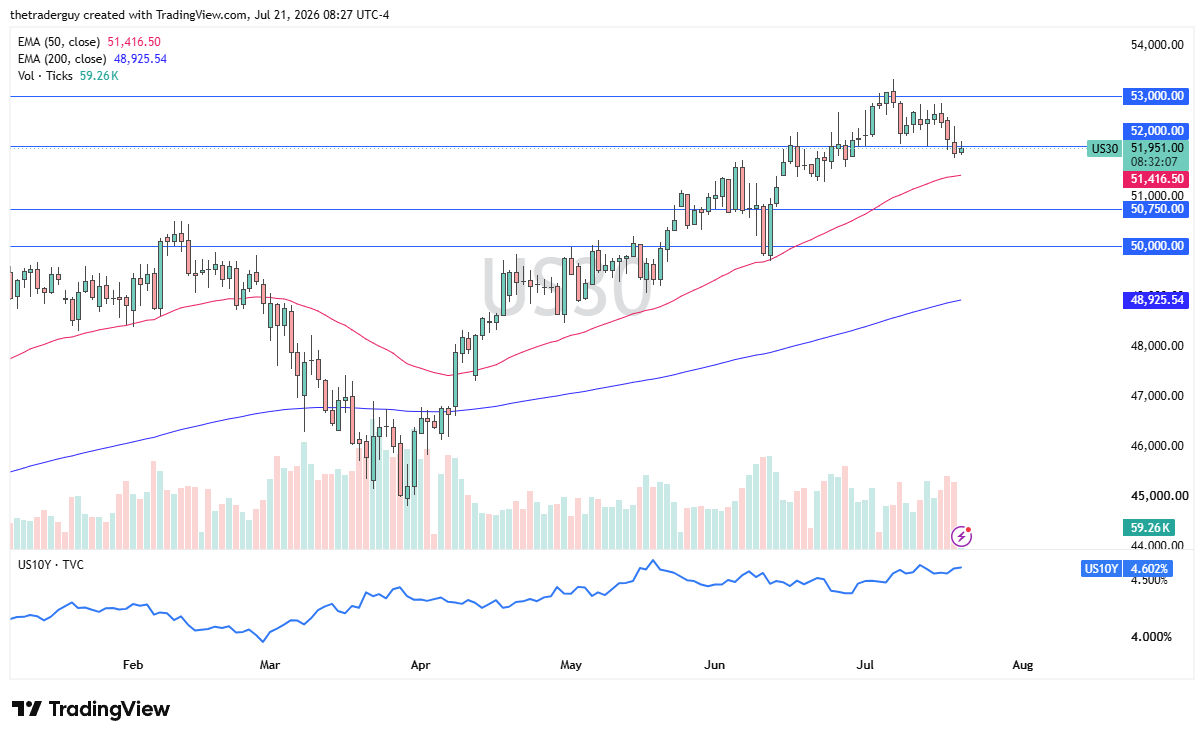
The Dow Jones 30 rallied initially during the trading session on Tuesday, but it looks like it is just going to struggle to hang onto those gains from what we have seen so far. That being said, it is still in a strong uptrend and has been for quite some time, so it is a bit sluggish, but I would not necessarily look at this and think most traders would see a trend change.
This is a market that is more likely than not going to continue to pay attention to interest rates around the world, and this is a market that also has been at a nice 45-degree angle to the upside as far as the trajectory of the trend is concerned. The 50-day EMA is at 51,416 and rising, and has acted a bit like a trend line, so it looks like it is still supported.
S&P 500 Technical Analysis
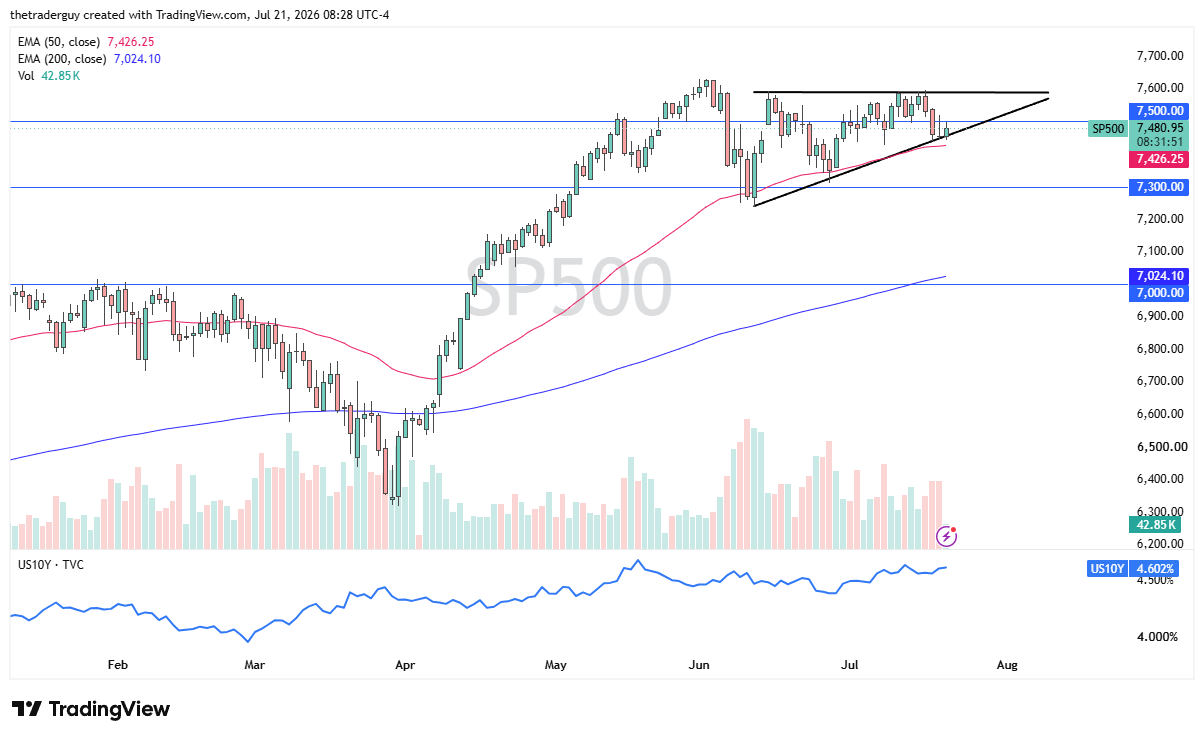
The S&P 500 is bouncing from a trend line of the ascending triangle that it has been trying to form. So, with that being said, the market looks very much like a market that is coiling up, and if it is going to continue to see this coil action, one would anticipate that perhaps it is a market that will eventually resolve.
As it is in an ascending triangle, a lot of traders may be looking for a bit of upward pressure. We will just have to wait and see. But the 7,500 level continues to be a little bit of short-term resistance. Breaking above there would lead to more confidence for me, at least, that this market could rally. To the downside, the 50-day EMA offering support, I think, is something worth watching.
If you’d like to know more about technical analysis and how traders use it, please visit our educational area.