
BTC-Spot ETF Inflows Keep Bitcoin Above $100,000
Bitcoin (BTC) slipped 0.3% on Saturday, May 17, adding to Friday’s 0.26% loss to close at $103,236. Despite a second consecutive daily loss, BTC held above $100,000 for a ninth session.
A US-China trade war truce drove demand for risk assets, with the Nasdaq Composite Index ending the week up 7.15%.
BTC rallied to a May 12 high of $105,756 before retreating amid uncertainties surrounding the GENIUS Act. However, US BTC-spot ETF market inflows cushioned the downside, holding BTC above $100,000.
According to Farside investors, BTC-spot ETF issuers recorded total net inflows of $608.4 million in the week ending May 16. BlackRock’s (BLK) iShares Bitcoin Trust (IBIT) dominated, with net inflows of $841.7 million. Meanwhile, Fidelity Wise Origin Bitcoin Fund (FBTC) had net outflows of $122.2 million.
Notably, the US BTC-spot ETF market extended its inflow streak to five weeks.
ETF Store President Nate Geraci remarked on IBIT’s flows, stating:
“iShares Bitcoin ETF now w/ inflows 22 of past 23 days… $6+bil new $$$. This is legit inst’l & wealth management $$$ being allocated IMO. No view on price, but still think extremely early in mainstream “tradfi” adoption. Like top of the 1st inning. Maybe 2nd.”
The ongoing deployment of longer-term capital into BTC-spot ETFs could further support BTC price gains.

BTC Price Outlook: Key Drivers
BTC’s short-term price outlook hinges on several key macro and market drivers:
- US-China trade headlines will likely influence risk sentiment and broader crypto market trends.
- The GENIUS Act vote could dictate sentiment toward the Bitcoin Act and the supply-demand trajectory.
- US economic data may influence Fed rate cut bets and recession risk.
- US BTC-spot ETF flows remain crucial to near-term price trends.
BTC Price Scenarios:
- Bullish Scenario: Easing trade tensions, dovish Fed bets, passing of the GENIUS Act, Bitcoin Act momentum, and strong ETF inflows may drive BTC toward $110,000.
- Bearish Scenario: Renewed trade tensions, hawkish Fed signals, legislative gridlock, or ETF outflows could drag BTC toward $90,000.
For ongoing insights into macro trends, regulation, and ETF data, follow our analysis here.
Bitcoin Price Forecast
Every new Bitcoin analysis as it publishes, today's technical signal and key levels, live price — on one page.
See all Bitcoin forecastsTechnical Analysis
Bitcoin Analysis
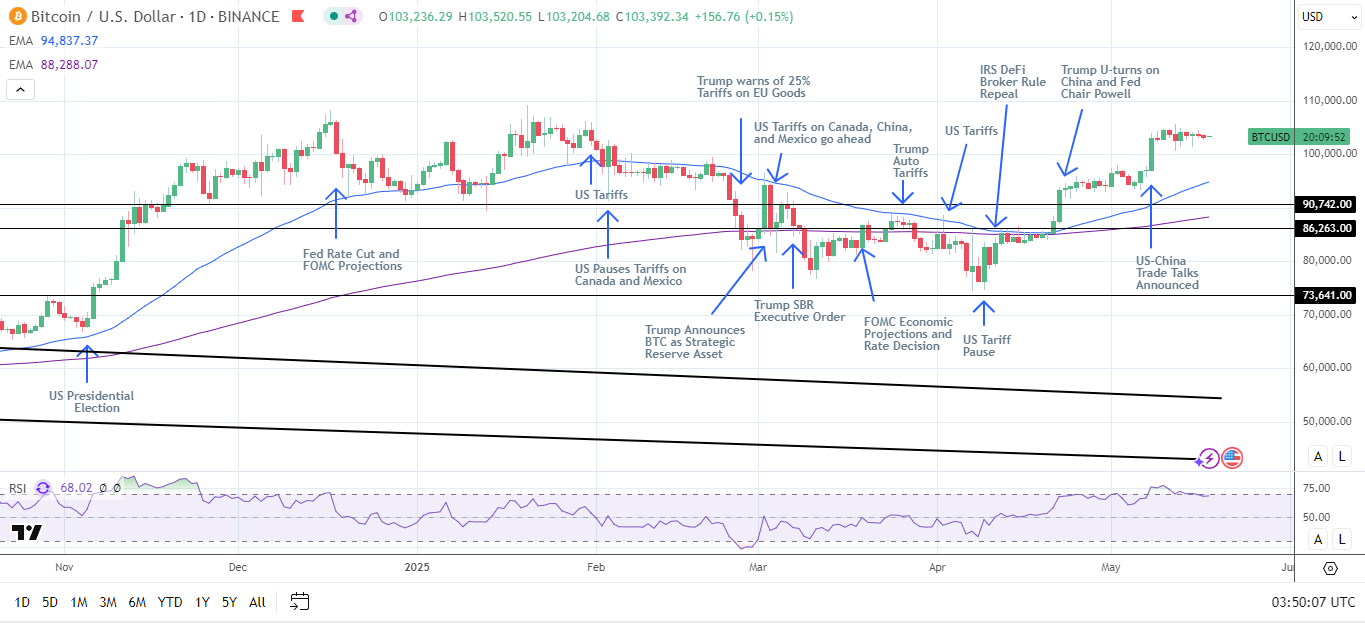
BTC remains above the 50-day and the 200-day Exponential Moving Averages (EMA), reaffirming bullish momentum.
- Upside Target: A break above the May 12 high of $105,756 could pave the way to the record high of $109,312. A decisive move beyond $109,312 may bring $115,000 into view.
- Downside Risk: A drop below $100,000 could send BTC toward the 50-day EMA. Increasing selling pressure may expose the $90,742 support level.
The 14-day Relative Strength Index (RSI) at 68.02 shows BTC has room to climb to $109,312 before entering overbought territory (RSI > 70).
Stay ahead of market trends by accessing real-time BTC price data and technical indicators here.
Ethereum Analysis
Turning to ethereum (ETH), ETH benefited from improving market risk sentiment.
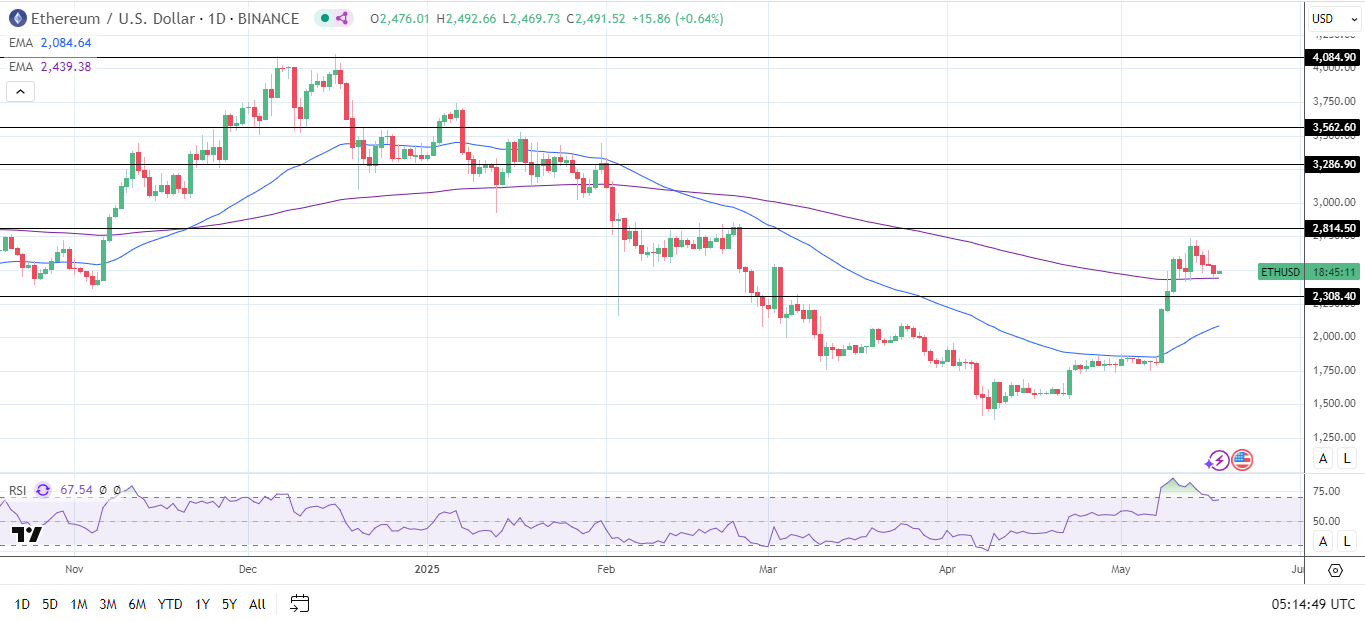
ETH remains above the 50-day and 200-day EMAs, affirming bullish momentum.
- Upside target: A breakout above the May 13 high of $2,738 could enable the bulls to target the $2,815 resistance level. A sustained move above $2,815 could bring $3,000 into play.
- Downside risks: If ETH drops below the 200-day EMA, the $2,308 support level would be the next key support level.
The 14-day Relative Strength Index (RSI) at 67.54 indicates ETH could climb to the May 13 high before entering overbought territory (RSI > 70).
Stay informed on BTC and ETH trends by tracking macroeconomic developments, ETF flows, and technical indicators in real-time here.