



Bitcoin Holds Key Support as Bulls Target $77K Rally
Since our July 1 update, we have been Bullish on Bitcoin (BTC) using the Elliott Wave Principle (EWP) and Technical Analysis (TA). In our last update (see here), we showed that we tracked a potential five waves higher, contingent on BTC staying above at least $62,474, our 3rd warning level for the Bulls.
Fast forward four weeks, and BTC held the $62,474 level, with its lowest close at $62,727 on August 1. Since then, it’s been staging a 3rd-of-a-3rd wave rally. See Figure 1 below.
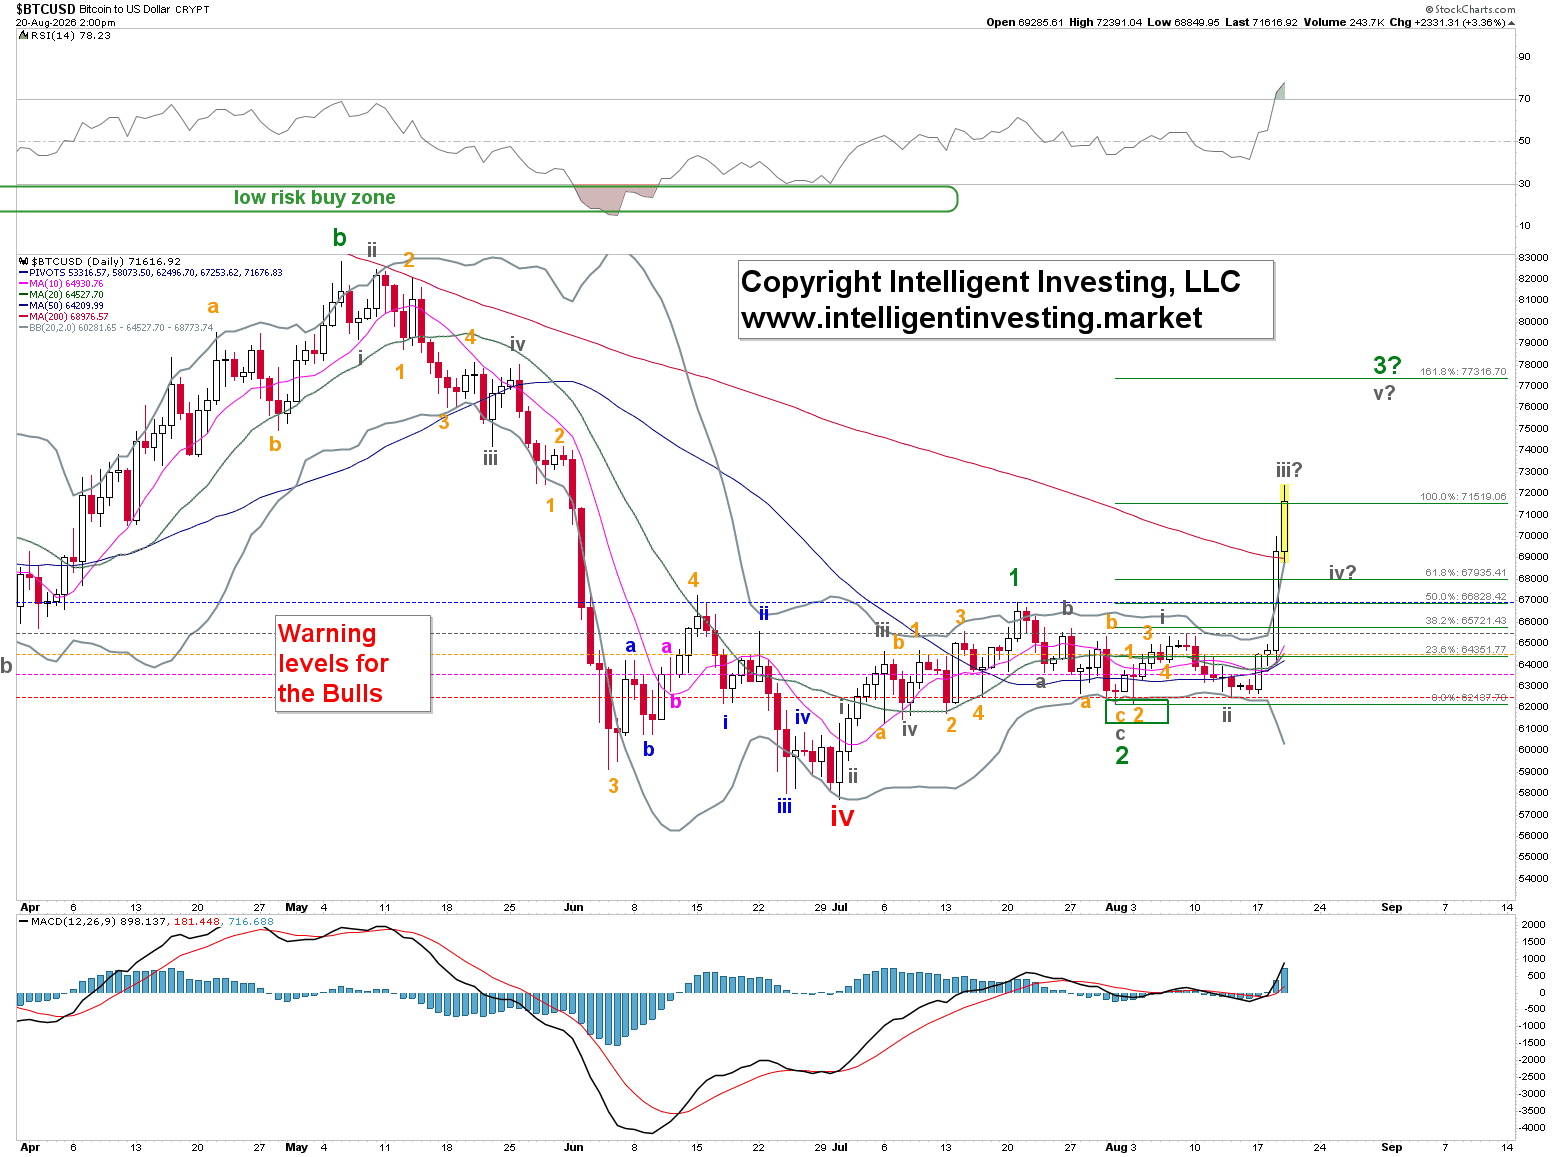
Bitcoin short-term Elliott Wave count showing key support and warning levels, momentum indicators, and a potential move toward $77,000. Source: Intelligent Investing, LLC/TradingView.

BTC Must Hold $65,418 to Keep the Bullish Structure Intact
Thus, our previous calls for higher prices were correct. We continue to track the potential for five (gray) waves (i, ii, iii, iv, v) higher within the green W-3, ideally around $77,000, contingent on BTC staying above at least $65,418, which is our 3rd warning level for the Bulls. Because the 4th and 1st waves (gray W-iv and W-i) don’t overlap in an impulse, there is a >60% chance the current uptrend is over if that overlap occurs.
Bitcoin Cycle Outlook Shifts Toward $164K–$337K Target Zone
Given the ongoing bullish price action and as stated previously, we continue to view the 4-year cycle, which has worked over the last 12 years and projected a low between late November and late January, as invalidated. Bitcoin continues to move impulsively, so we continue to track a potential five-wave advance from the July 1 low. If it materializes, we can be certain an important low has been struck and that the Fibonacci-based $164-337K region will be the next major target zone for the red W-v of the black W-5, etc. See Figure 2 below.
Bitcoin Price Forecast
Every new Bitcoin analysis as it publishes, today's technical signal and key levels, live price — on one page.
See all Bitcoin forecasts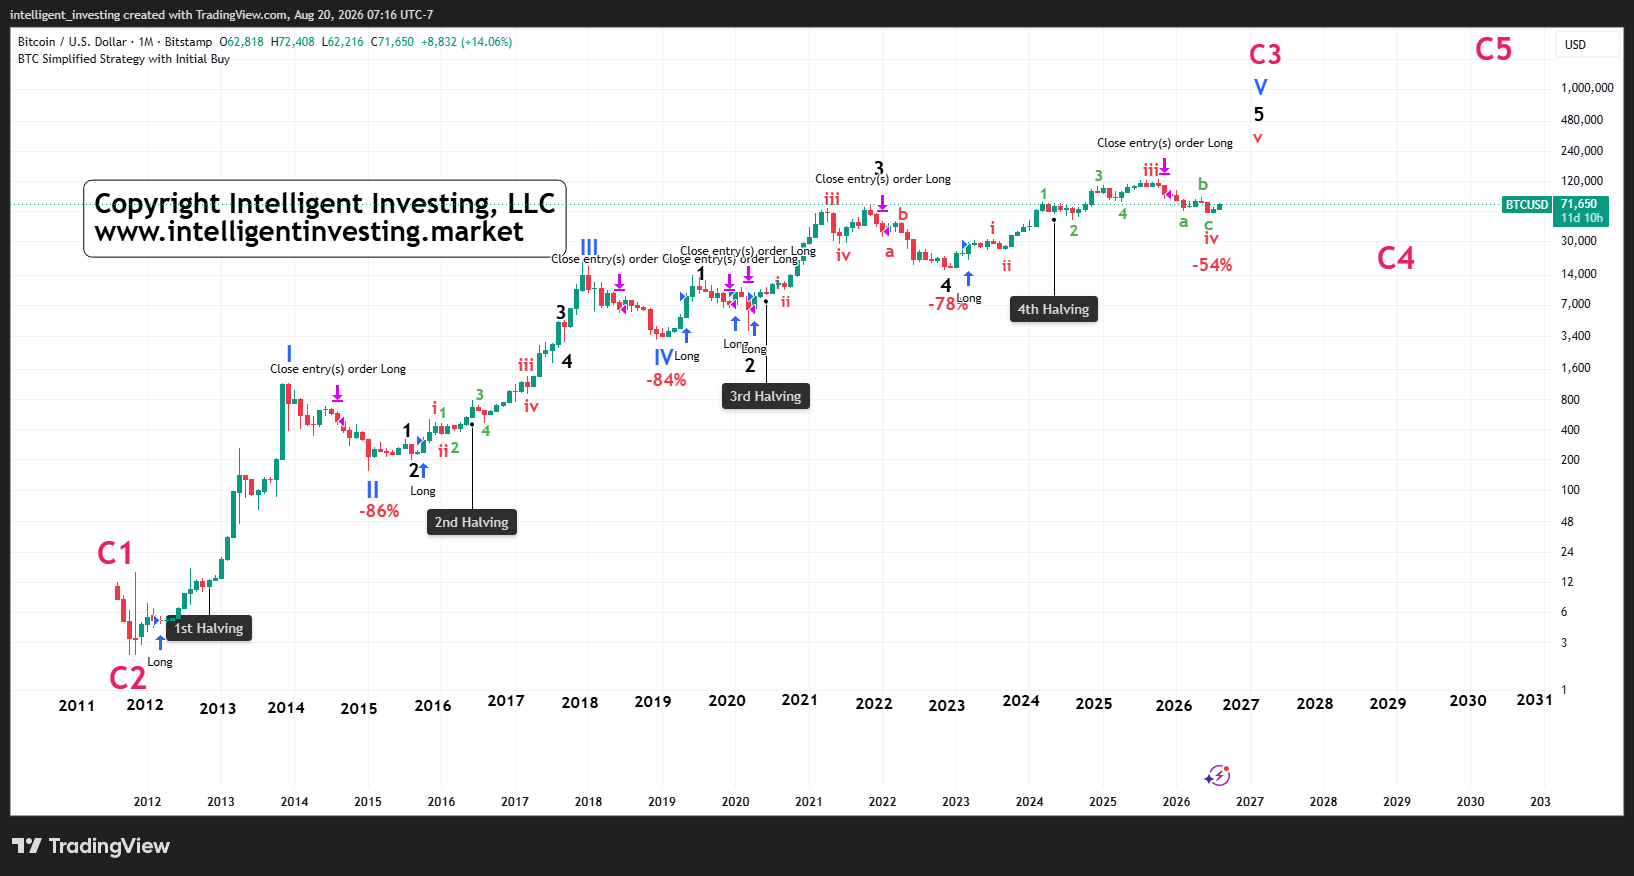
Long-term Bitcoin Elliott Wave count showing prior halving cycles, major drawdowns, and the broader projected wave structure. Source: Intelligent Investing, LLC/TradingView.



