
Bitcoin (BTC) has gone up by 3% in the past 7 days and seems to be heading to retest the $66,000 resistance — a key level that, if broken, could trigger the beginning of the top crypto’s next leg up.
A challenging macroeconomic backdrop has prevented BTC from climbing off this level two times already, but this third time could be the charm as net inflows to exchange-traded funds (ETFs) spiked this week.

Net Inflows to Bitcoin ETFs Spiked to $850 Million This Week
According to data from SoSoValue, investors poured $850 million into these vehicles from Monday to Friday, starting the month with a positive tone.
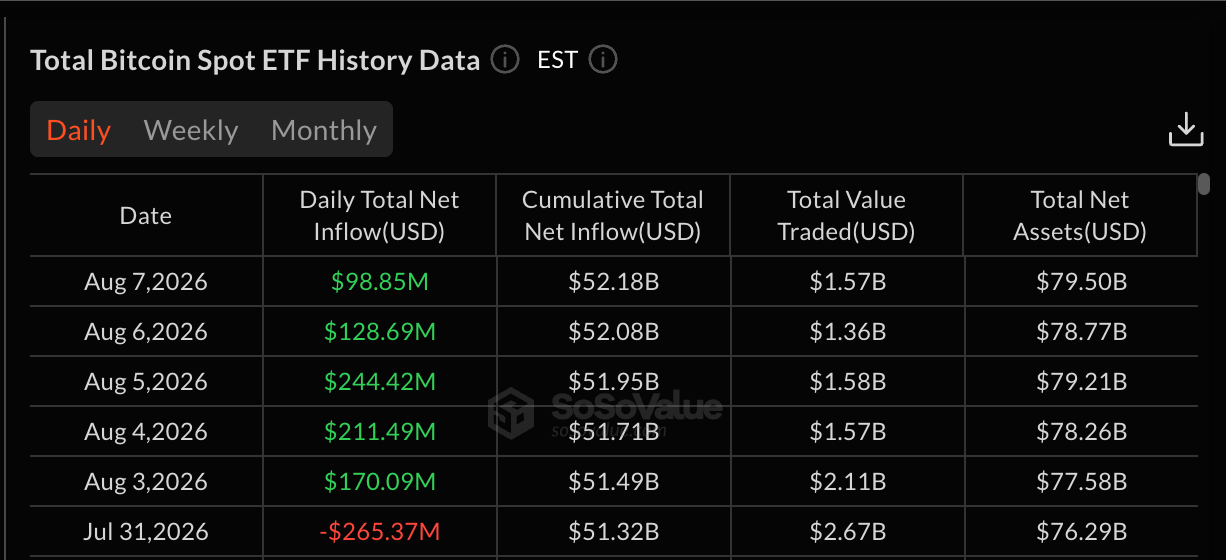
In July, net inflows finished at just $170 million, meaning that this week has already surpassed last month’s total figure by 5 times. Whether this is a sustainable pace or not will depend on BTC’s ability to break its current ceiling.
In addition to macroeconomic headwinds, the Coldcard exploit, a technical weakness in a Bitcoin-only cold wallet, has resulted in the loss of nearly $250 million and shocked the crypto community as it questioned the safety of these supposedly air-tight devices.
Moreover, persistent geopolitical tensions in the Middle East and a hawkish Federal Reserve add to the mounting challenges that Bitcoin has to overcome to climb to higher levels and reverse its current downtrend.
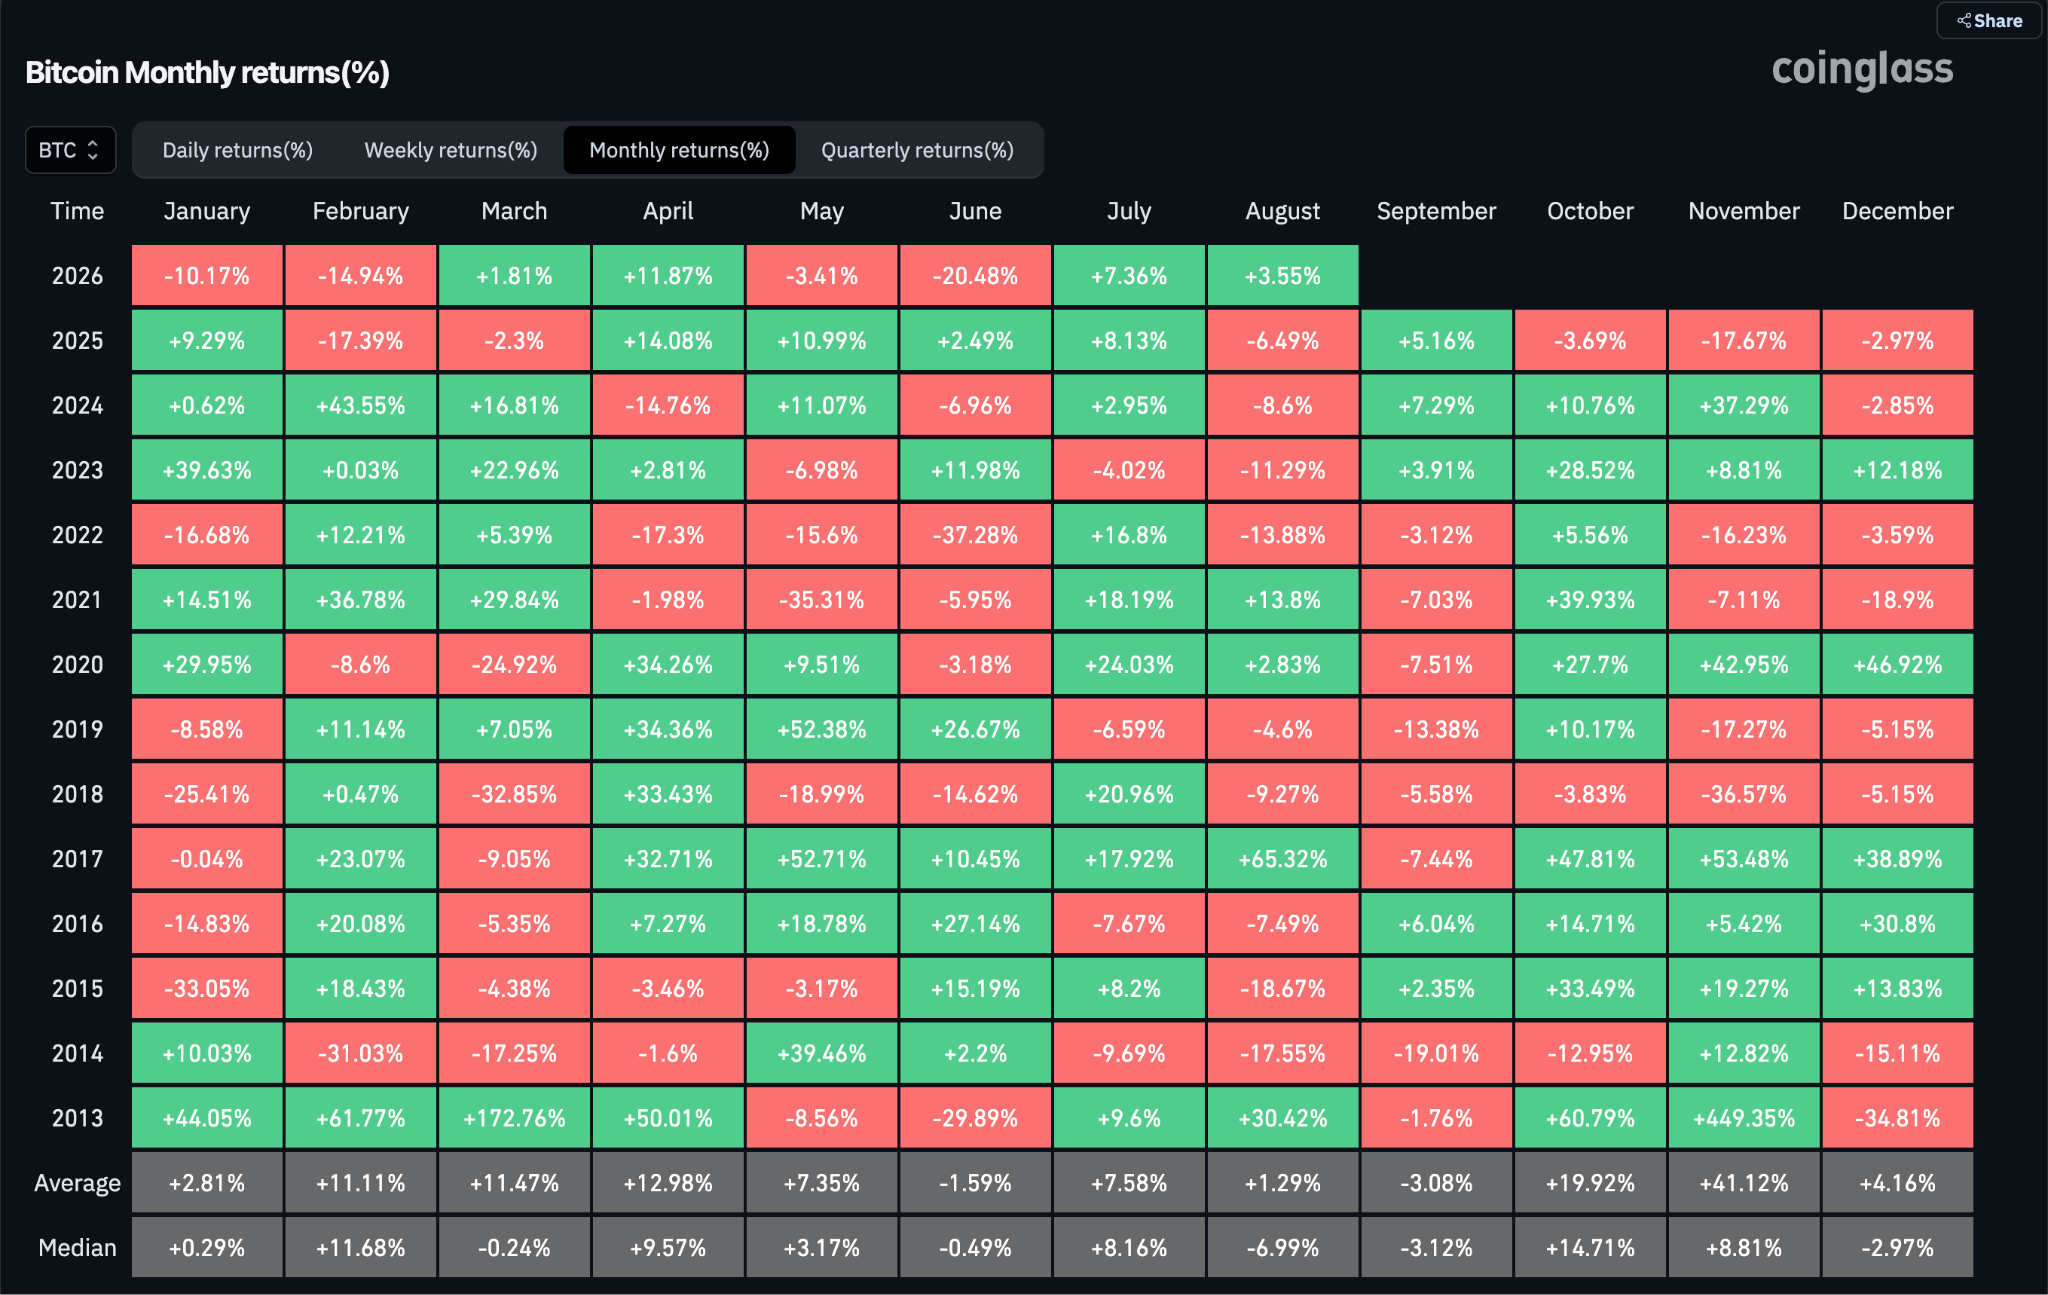
Historical performance patterns indicate that August has typically been a bad month for BTC, as the top crypto has closed this period in red territory in 9 out of the past 13 years. Interestingly, these losses have been mild, ranging from 4% to 19%.
In contrast, in the instances that BTC has closed August with a positive performance, its gains have been quite strong, ranging from 3% to 65%.
Bitcoin Price Forecast
Every new Bitcoin analysis as it publishes, today's technical signal and key levels, live price — on one page.
See all Bitcoin forecastsBitcoin Could Rise to $75,000 If This Bullish Pattern Plays Out
Heading to the price action, we have been keeping track of a bullish inverse head and shoulders pattern that has formed in the daily chart.
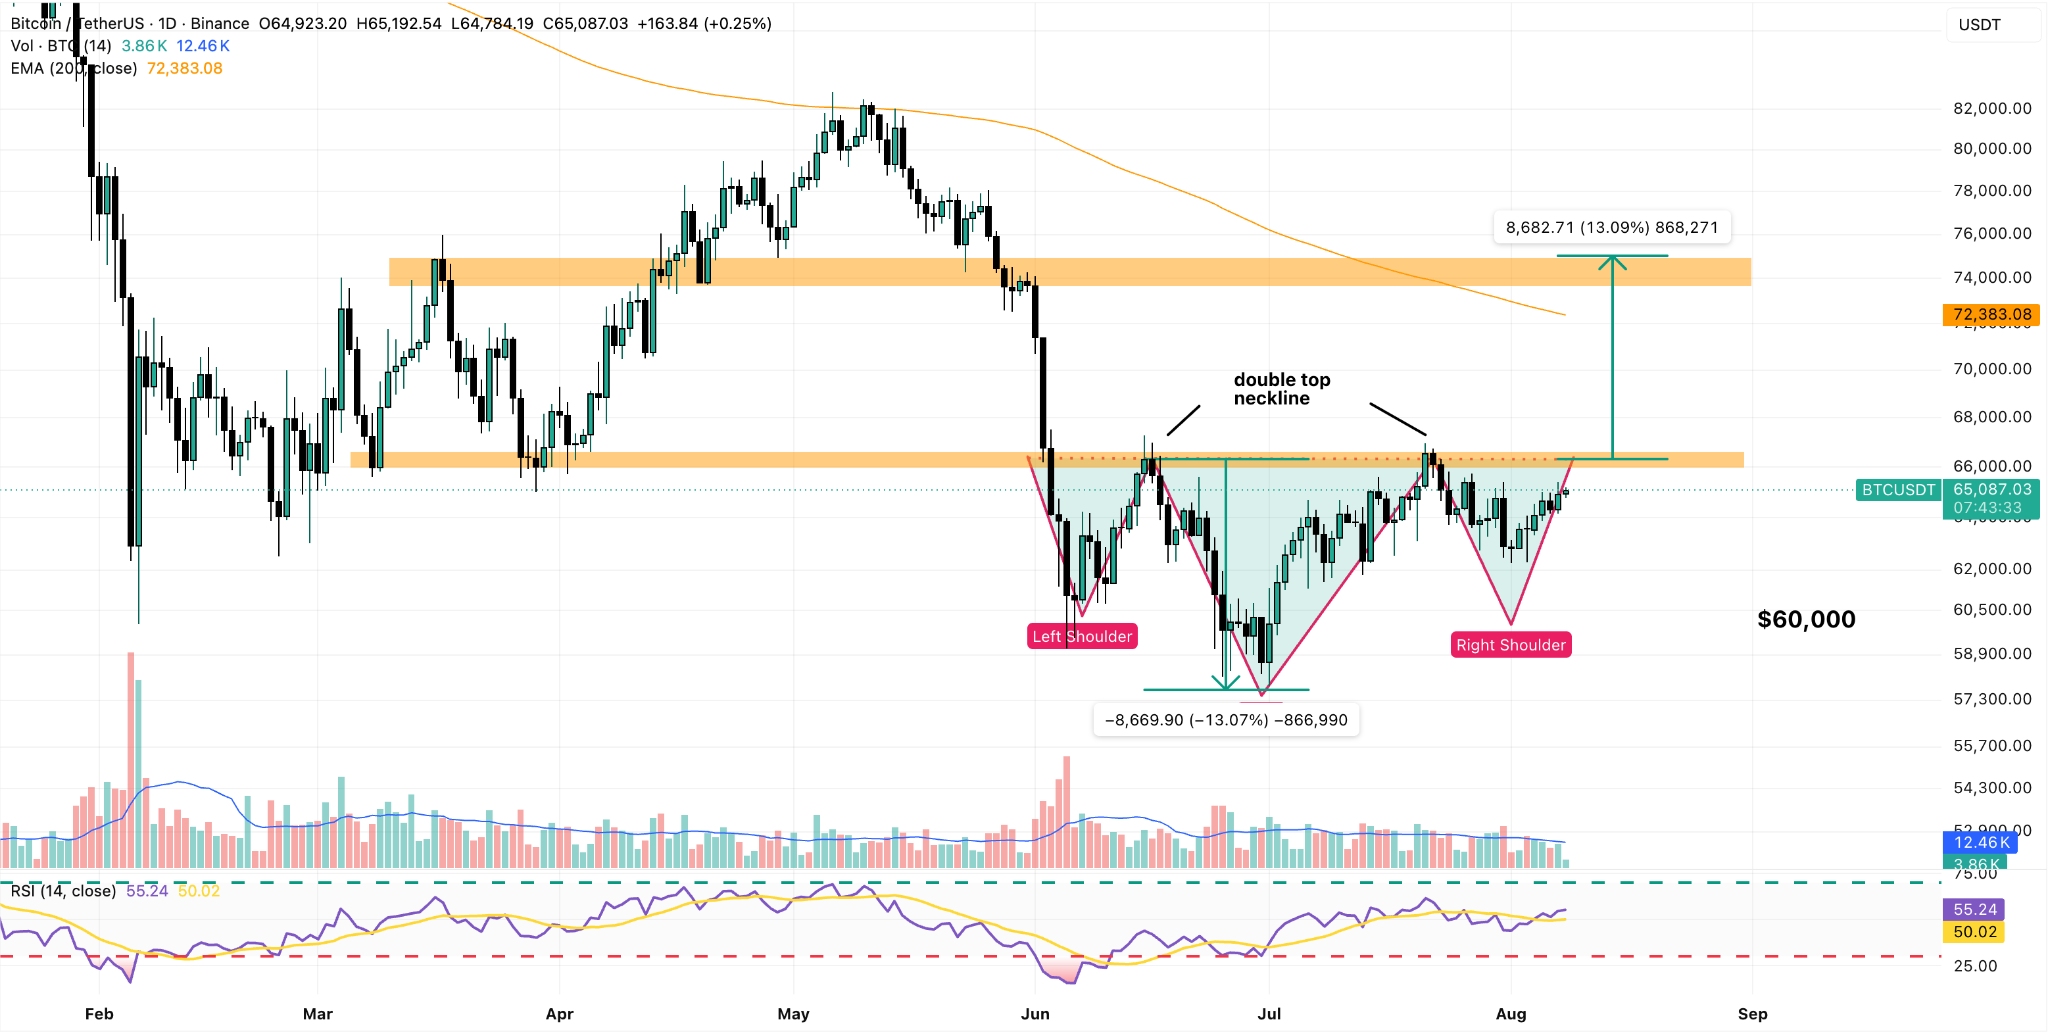
This setup points to a projected target of $75,000 based on the size of the head. The price would have to break past the $66,000 level, as this is the pattern’s neckline.
If that’s the case, we expect a retest of the 200-day exponential moving average (EMA), followed by a breakout if bullish momentum gains enough steam. Such a move could indicate the beginning of Bitcoin’s next bull market.
Meanwhile, if the headwinds cited earlier continue to prevent BTC from climbing above $66K, this would form a triple-top pattern that could result in a retest of the $60,000 level in the near term.
Positive momentum is already accelerating as the Relative Strength Index (RSI) just crossed above the signal line. A decisive move above 60 will likely be interpreted as a buy signal by market participants and could trigger the next big move for BTC.