Third Test of $139.11 Holds
Coinbase Global, Inc. (COIN) stock has been showing signs of strengthening and the potential to complete a long-term bottoming process. A third decline this year tested a key support zone in late-July and eventually produced a rally and signs of strength. The July swing low of $139.11 had already held as support during a decline in February and again later in the year. In addition, it was a support zone during a bearish correction that bottomed in April 2025. The July low followed Q2 2026 earnings the night before and was an area the market had clearly recognized as support previously.

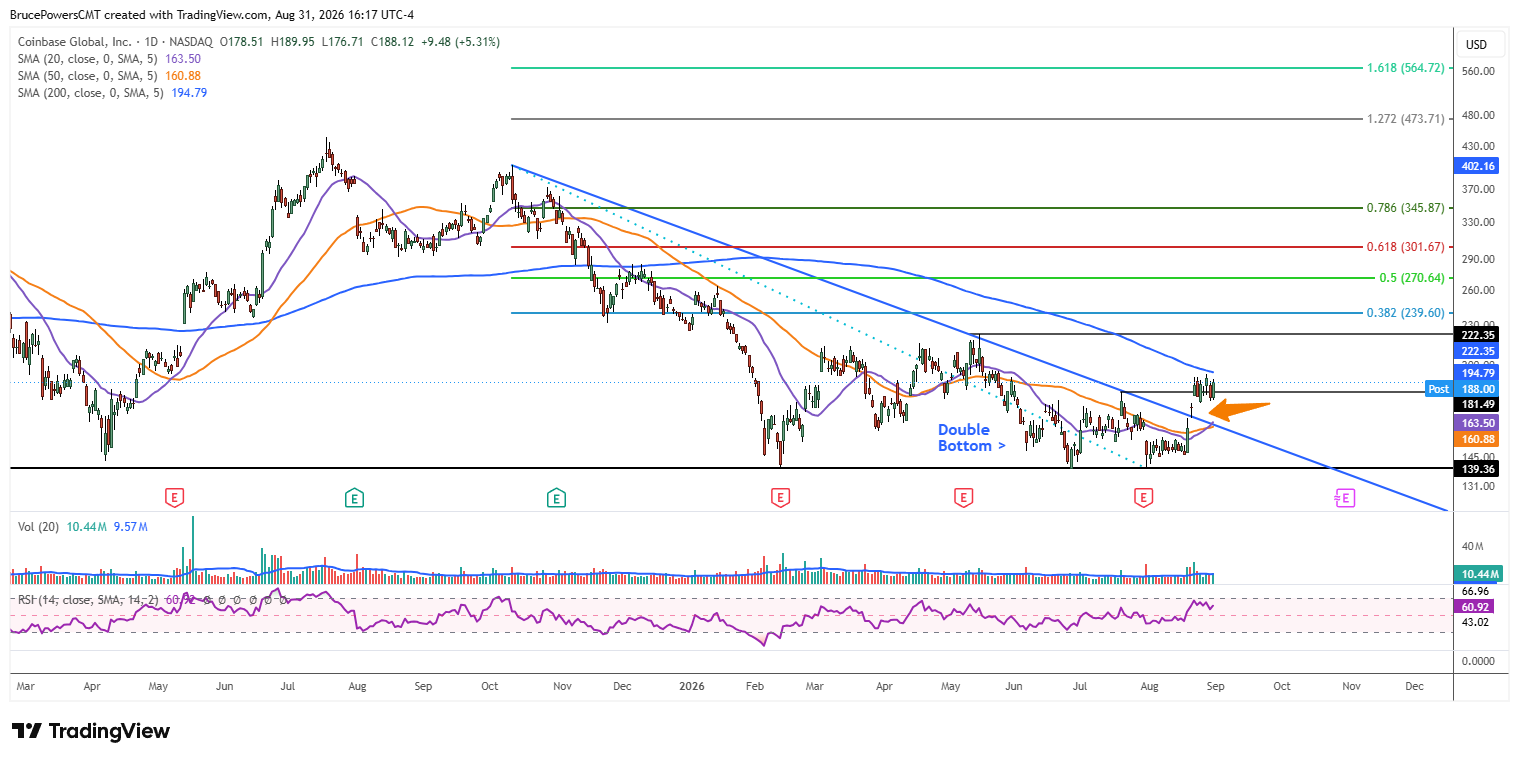
Double Bottom Reclaims Key Averages
Two weeks ago, bullish signals appeared on both the weekly and daily charts. An initial upside breakout of a double-bottom pattern triggered above $181.49, a downtrend line was broken, the 50-day moving average was reclaimed, and the 20-week moving average was reclaimed. Initial attempts to reclaim the 200-week moving average began.
A high of $193.81 for the advance was reached last week, putting COIN up against a resistance zone marked by the 200-day moving average, now near $194.80. If COIN can get above and stay above the 200-day moving average, it will reclaim a key resistance zone that needs to give way before the stock has a chance to go much higher.
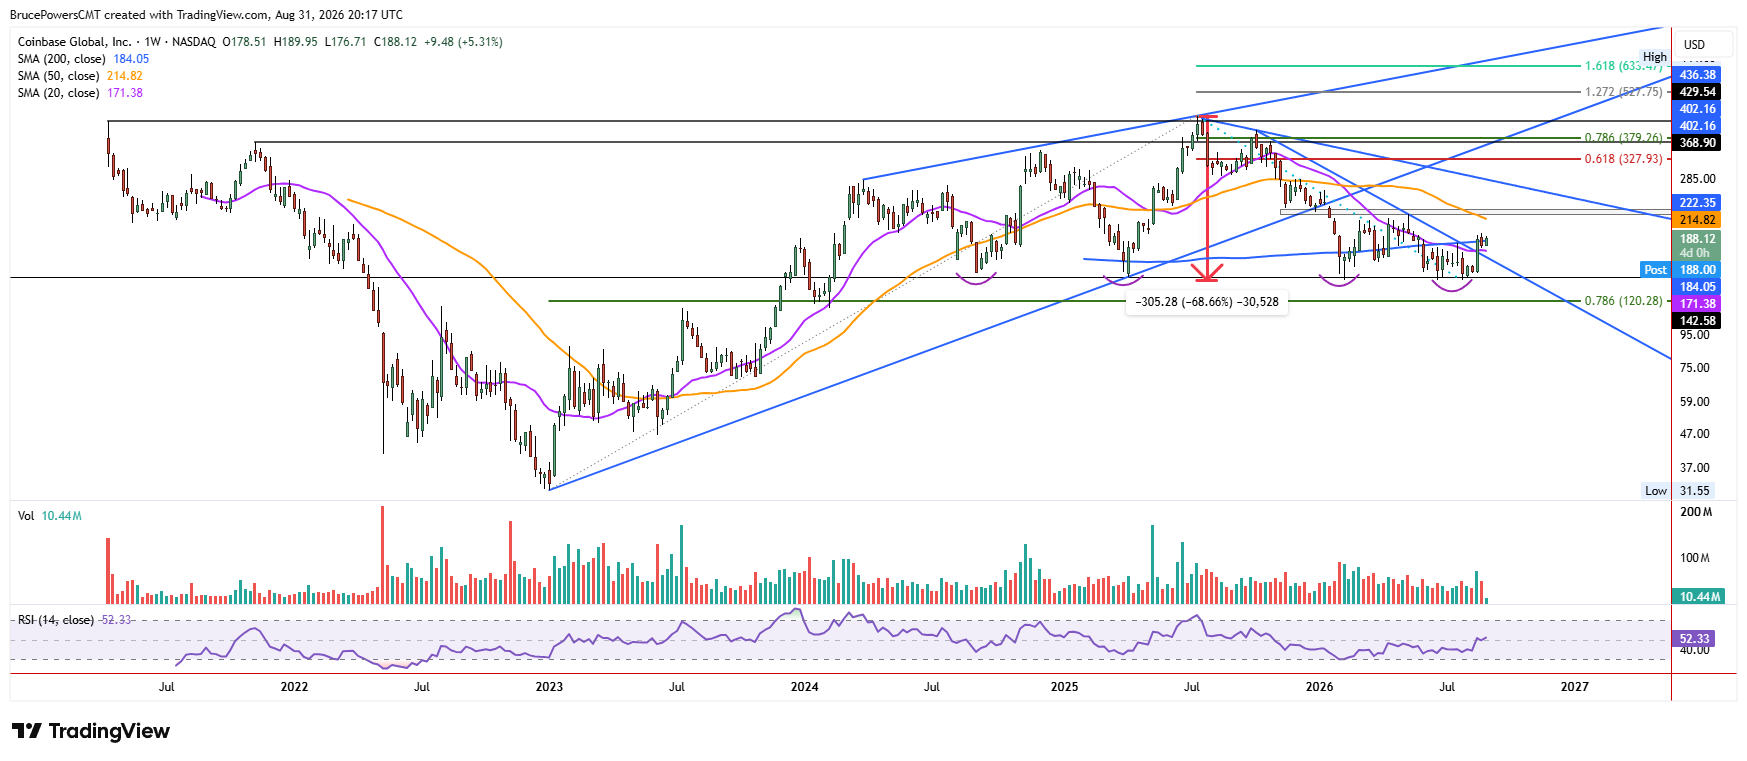
Flag Sets Up 200-Day Reclaim
For seven days a relatively tight range has formed near resistance at the 200-day moving average and above the previous resistance indicators noted above, showing behavior like a bullish flag. Key support during pullbacks is represented by the rising 20-day moving average at $163.65 and, if the 20-day fails, by the 50-day moving average near $160.88.
A decisive upside breakout above $193.81 would trigger a continuation of the current advance and a reclaim of the 200-day moving average for the first time since November 2025. An initial upside target, if buyers can retain control, is suggested near the 38.2% Fibonacci retracement of a prior decline at $239.60. Given the significance of a sustained reclaim of the 200-day moving average, a higher potential target may follow. In that sense, the same support that held at $139.11 in July now has a matching test overhead: whether COIN can convert the 200-day moving average from resistance into support and confirm that the long-term bottoming process is complete.
If you’d like to know more about technical analysis and how traders use it, please visit our educational area.