Bullish Breakout Gains Traction
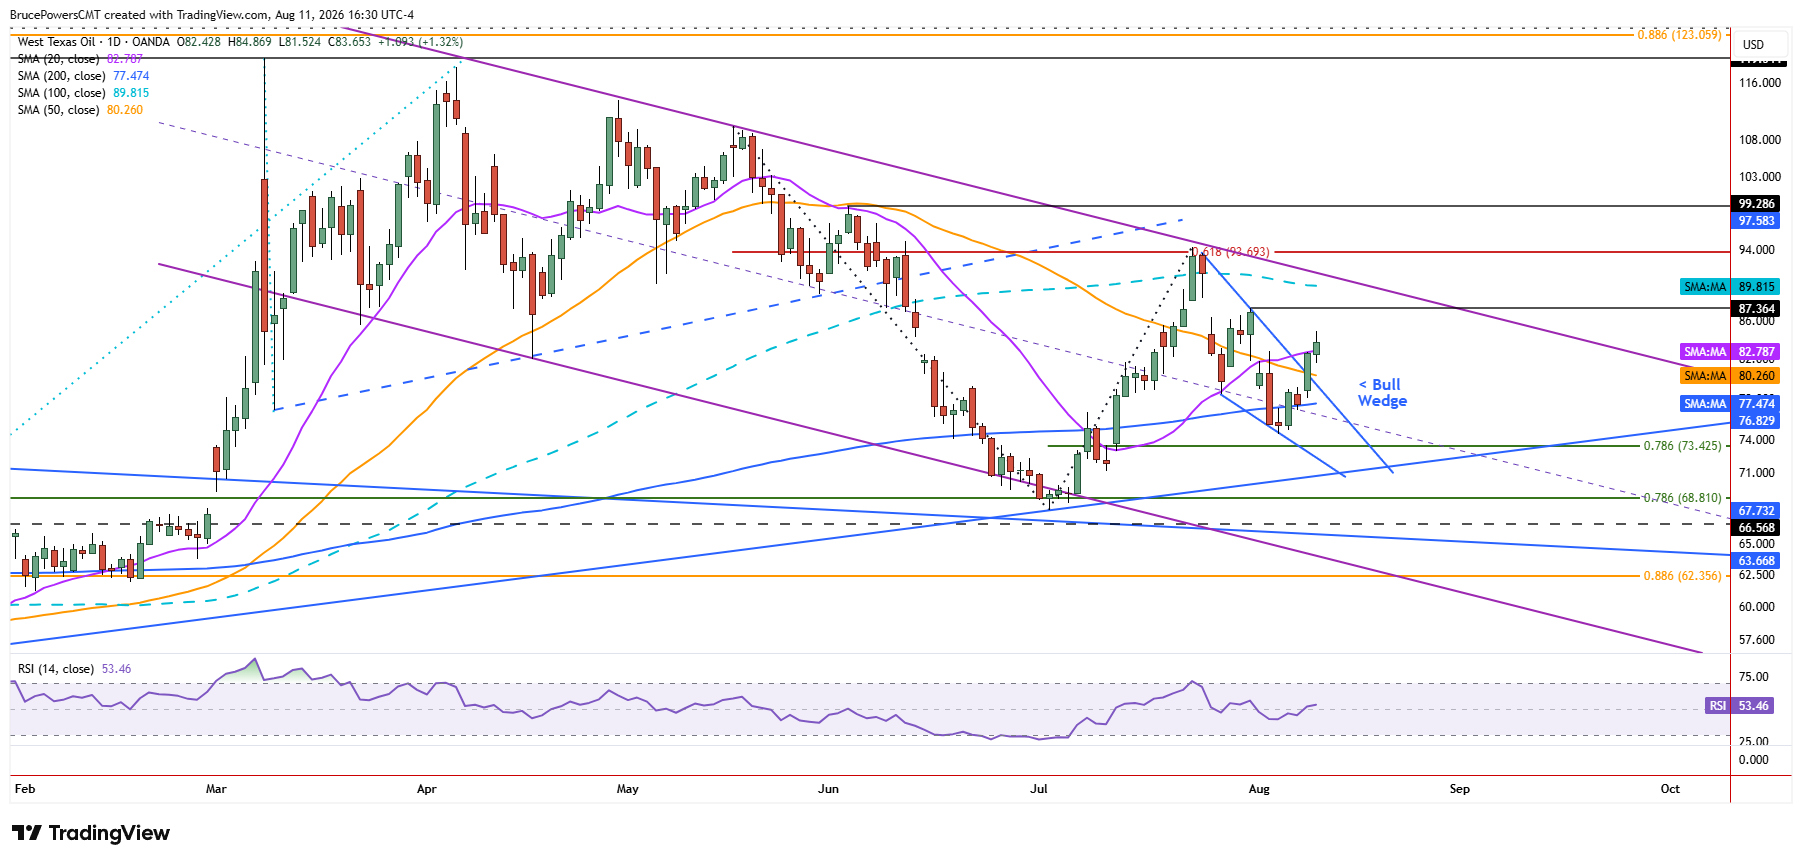
WTI crude oil advanced to a high of $84.87 on Tuesday, reclaiming the 20-day moving average and signaling a bullish reversal above an interim lower swing high at $82.76. A daily close above Tuesday’s high of $84.87 would confirm the strength suggested by the breakout. The advance followed a decisive upside breakout from a falling wedge continuation pattern on Monday, which also reclaimed the 50-day moving average on the same breakout.

$82.52 Sets Near-Term Risk
The higher daily low of $82.52 from Tuesday is short-term support. If broken to the downside, the 50-day moving average may be tested, currently near $80.25 and falling, particularly because it previously represented dynamic resistance. The falling wedge pattern has an initial upside target at the beginning of the pattern, near the recent swing high of $94.34.
That high completed a 61.8% Fibonacci retracement of the prior decline before sellers took back control, leading to the bottom of the wedge and a higher swing low at $74.60. A move toward $94.34 would therefore represent the first major test of whether Tuesday’s bullish reversal can develop into a larger trend change.
Path Toward $100 Emerges
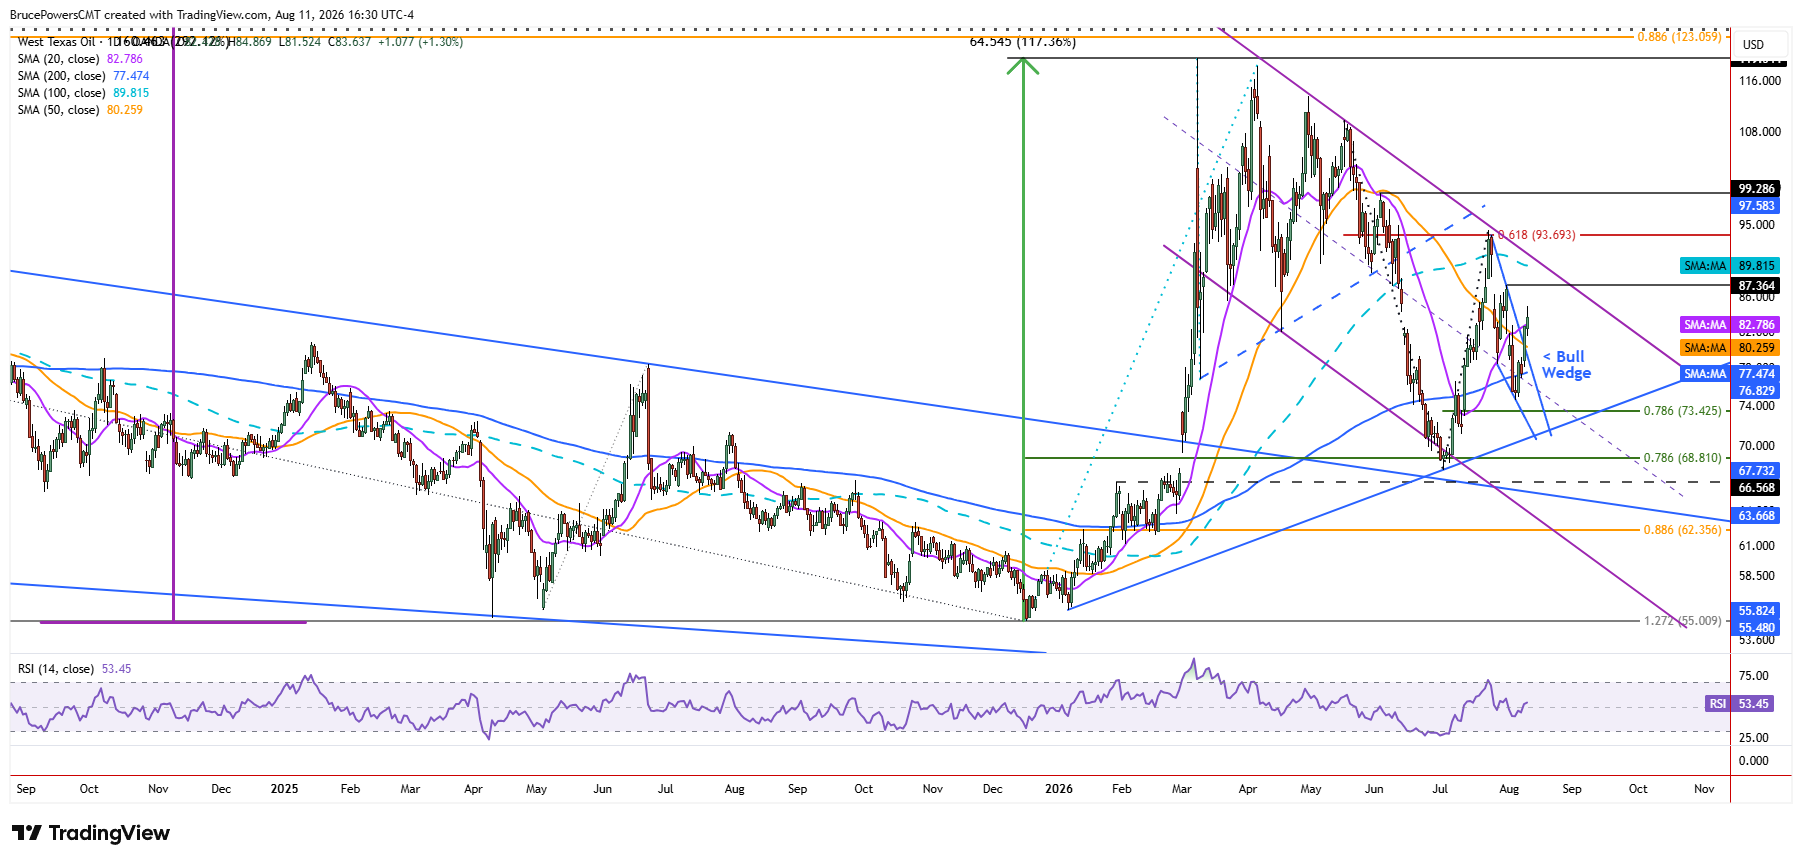
There are also higher measured targets from the wedge formation, but crude oil would first need to signal a stronger bullish reversal by advancing above the initial wedge target. That possibility would increase further upon a breakout above a downtrend line and the 100-day moving average, now near $89.81. If that happens, the extended wedge targets calculate to an estimated $96.36 and $100.12. The higher potential wedge target is very close to an interim lower swing high at $99.29, increasing its potential significance as an upside target. A sustained move through these resistance levels would provide stronger evidence that the falling wedge marked the end of the prior correction.
Crude oil needs to hold above the 50-day moving average to sustain the bullish strength indicated by the falling wedge breakout. Although the 200-day moving average near $77.47 provides an important support area, it should not be reached if buyers are able to sustain momentum triggered by Monday’s breakout and Tuesday’s follow-through. For now, $82.52 is the key near-term test. Holding above it retains near-term momentum, while a break below it may see a pullback to the 50-day moving average.
WTI Crude Oil Price Forecast
Every new WTI Crude Oil analysis as it publishes, today's technical signal and key levels, live price — on one page.
See all WTI Crude Oil forecastsIf you’d like to know more about technical analysis and how traders use it, please visit our educational area.