Dogecoin (DOGE) has pulled back sharply after failing to clear a major long-term resistance cluster, delaying a potential 200% breakout toward the $0.26-$0.27 region.

DOGE Rejected at 200-Day EMA Resistance
DOGE rallied to roughly $0.10 in August but failed to hold above its 200-day exponential moving average (200-day EMA, blue), currently near $0.095.
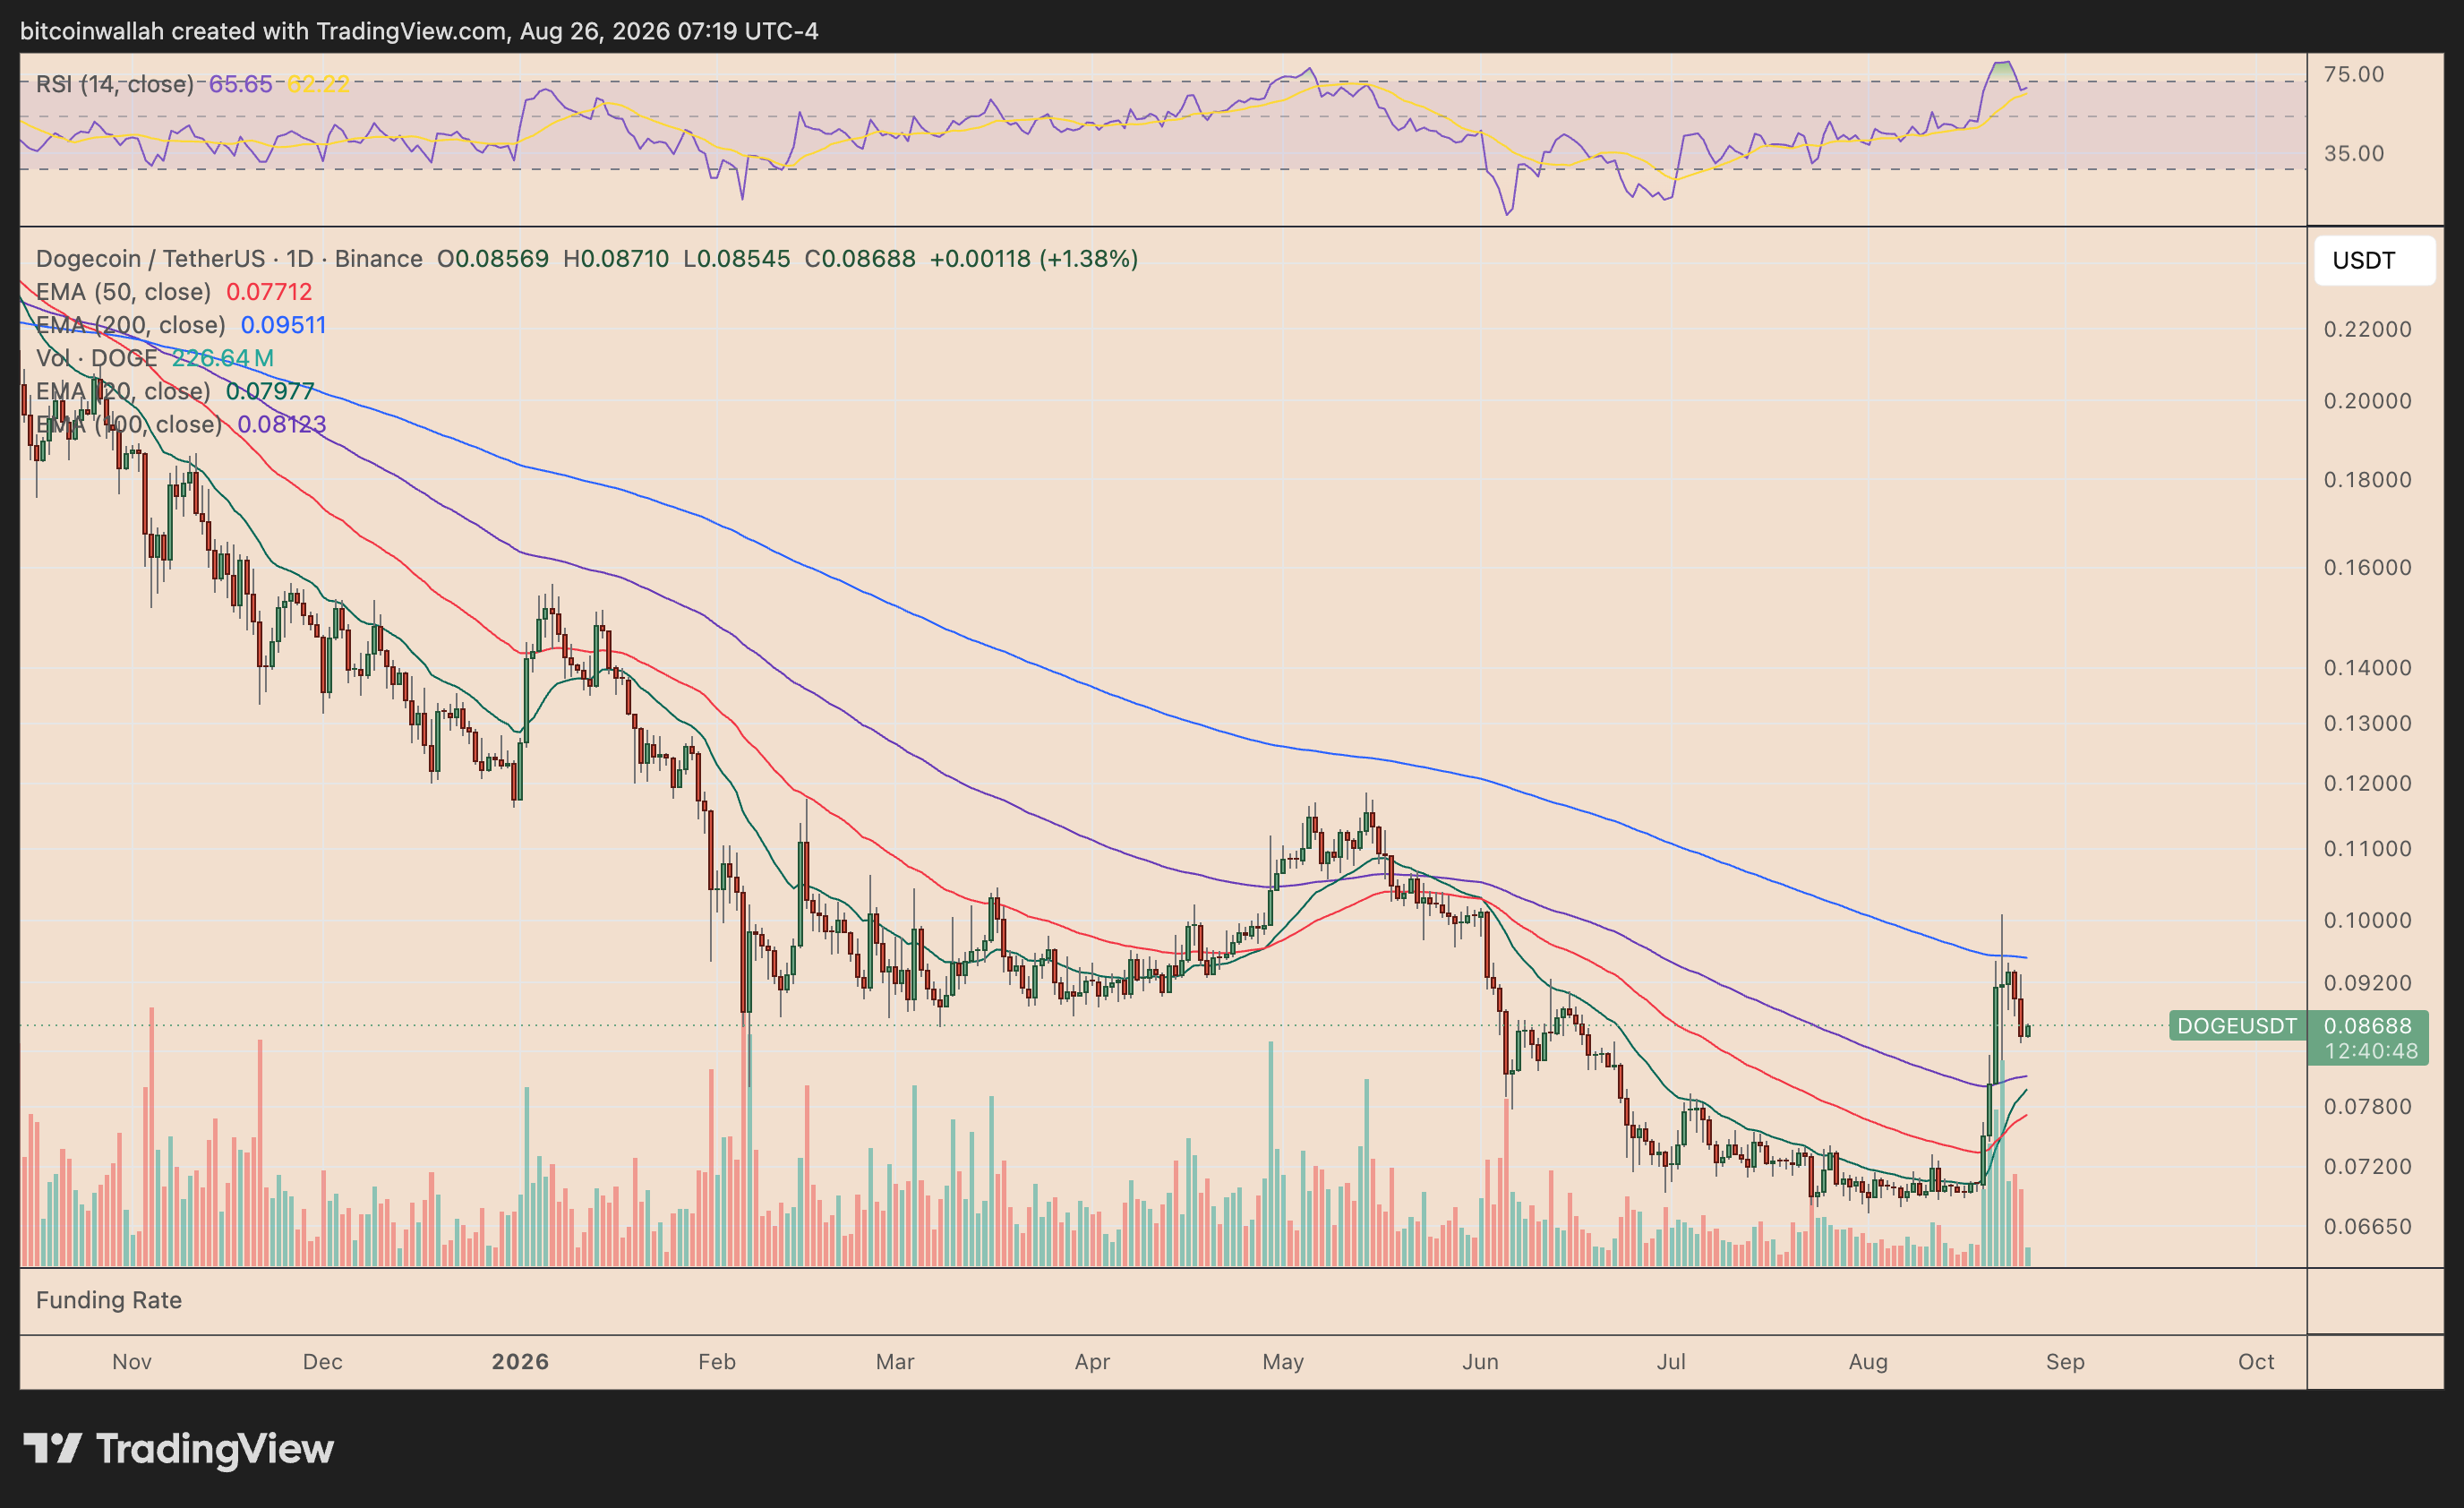
The memecoin has since dropped about 15% from its local top, trading near $0.087 as of Wednesday, Aug. 26.
The 200-day EMA overlaps with the upper trendline of Dogecoin’s prevailing falling wedge pattern.
Falling wedges typically resolve to the upside once price decisively breaks above their upper trendline. DOGE briefly pushed through the resistance zone during its latest rally but failed to establish the level as support.
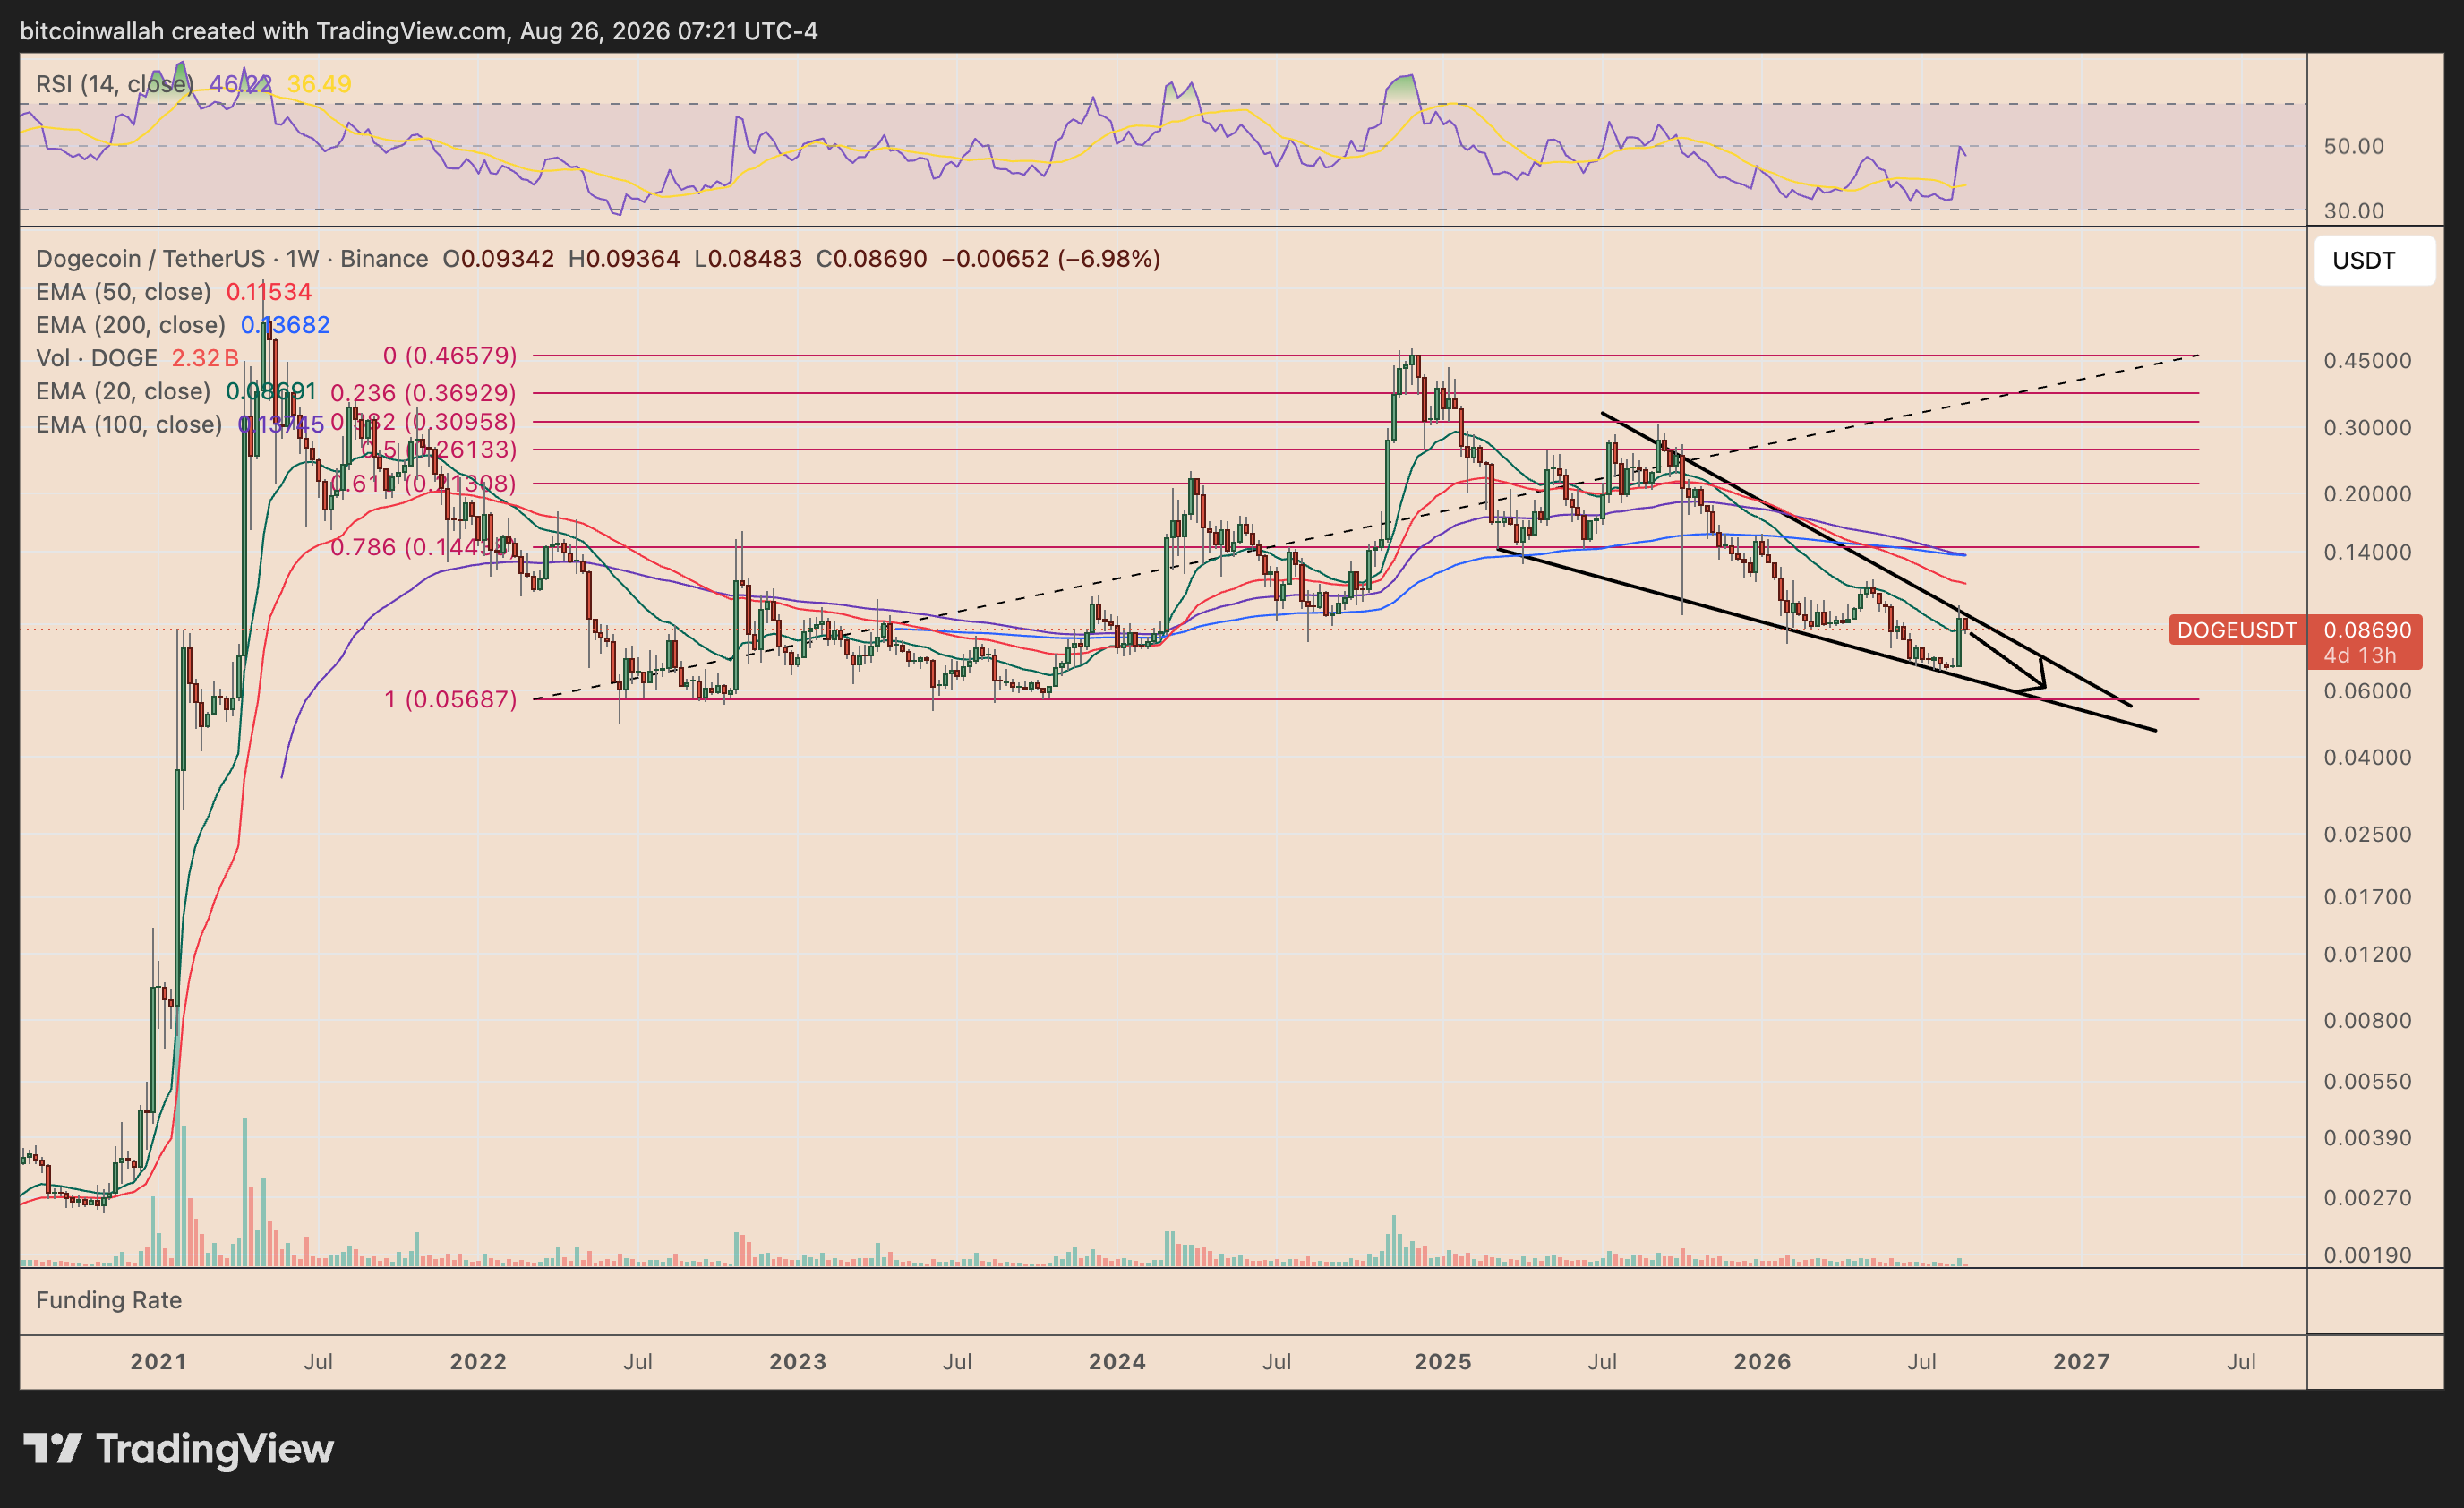
That suggests the larger breakout has been delayed rather than confirmed.
The latest rejection from the wedge’s upper trendline raises the possibility that Dogecoin will continue rotating toward the pattern’s lower boundary.
That support currently sits near $0.056-$0.060, roughly 35% below current prices. This region acted as a major long-term support area in previous market cycles in 2022-–2023.
Dogecoin Price Forecast
Every new Dogecoin analysis as it publishes, today's technical signal and key levels, live price — on one page.
See all Dogecoin forecastsDOGE Can Still Rally 200% After a Deeper Pullback
A rebound from the $0.056-$0.060 area could give DOGE another opportunity to challenge the wedge’s descending upper trendline.
The eventual upside target, however, will depend on where Dogecoin breaks out of the wedge.
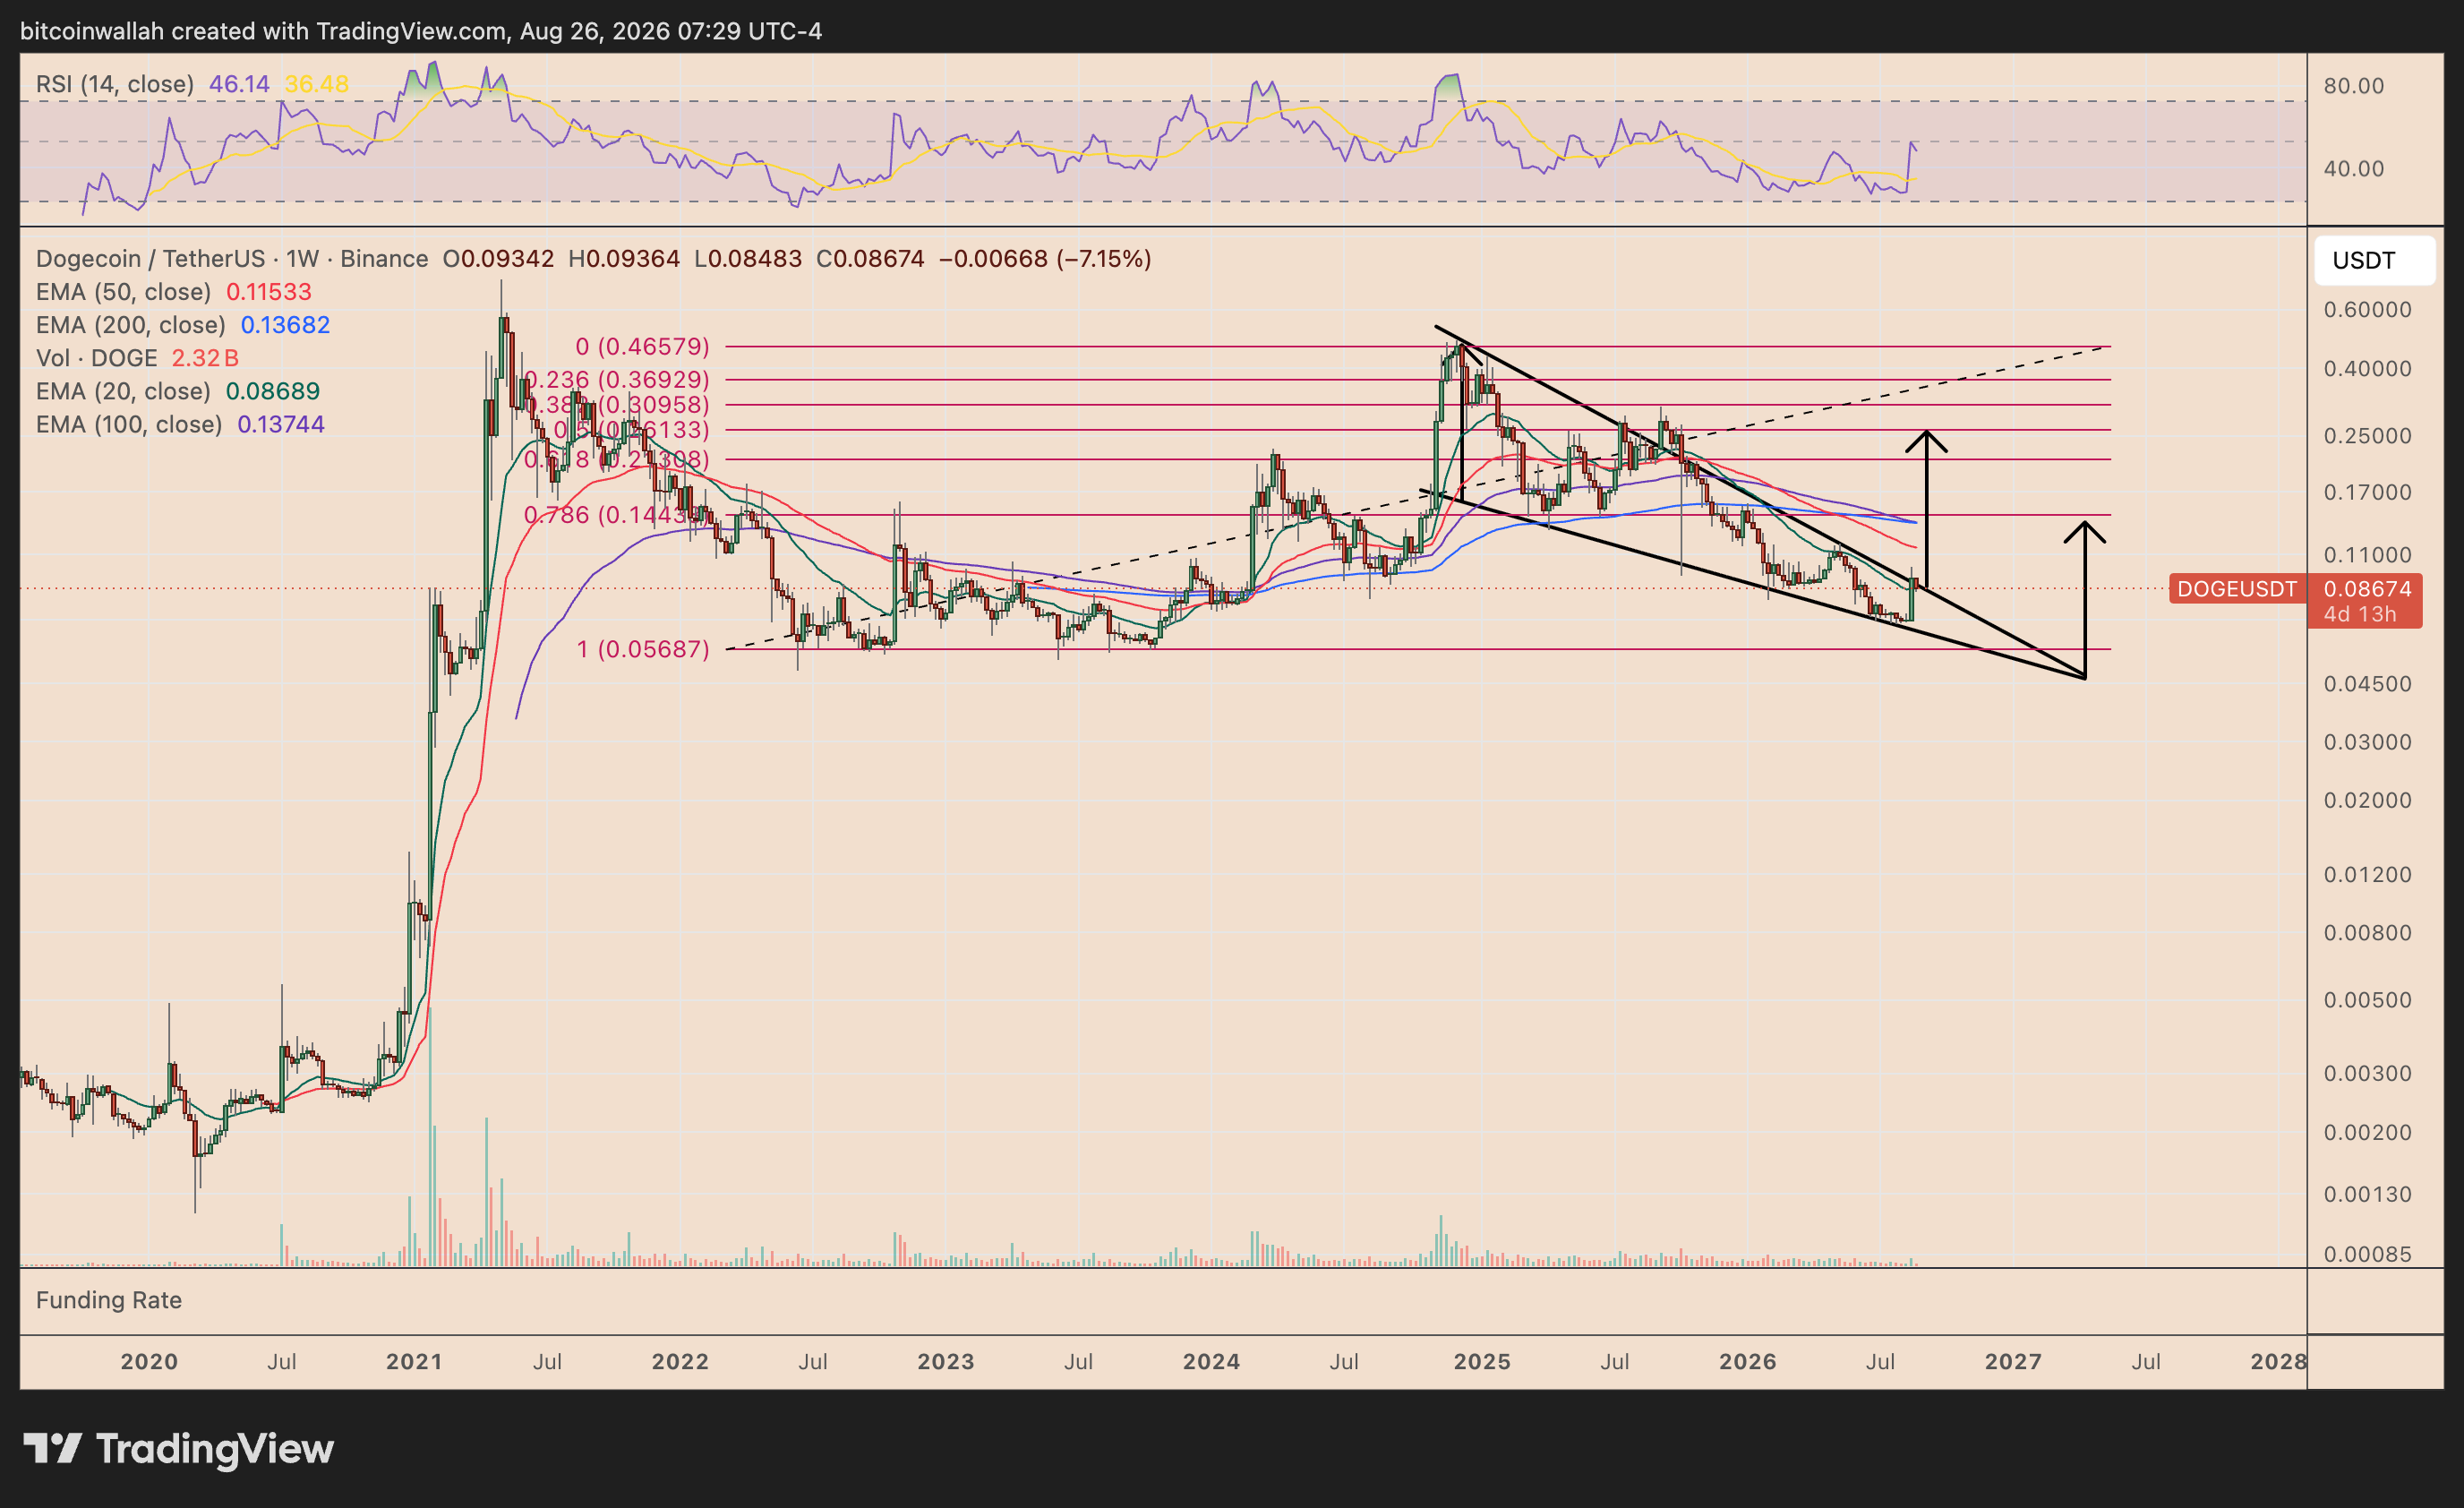
If DOGE remains inside the wedge for several more months and breaks out closer to its apex, the initial target could instead sit around the $0.144 area, near the 0.786 Fib level.
In other words, depending on the breakout point, DOGE’s broader recovery target could range between approximately $0.14 and $0.26.
For now, the failure to clear the wedge resistance leaves the downside path toward $0.056-$0.060 open before another breakout attempt develops.