


Ethereum (ETH) is currently the top-performing token in the top 5 in the past 30 days with a 13.5% gain, following a confirmed breakout of a key resistance at $1,800.
Exchange-traded funds (ETFs) linked to ETH have booked a 4-day streak of positive net inflows. During this period, investors have poured nearly $185 million, indicating a positive shift in sentiment.

Trading Volumes Don’t Indicate That a True Recovery Has Started for ETH
Trading volumes are currently accounting for 4.5% of the asset’s circulating market cap. At around $10 billion, these are strong volumes compared to the usual daily readings of these last few months.
However, volumes are historically low at this point. We had been tracking a signal based on how this metric has behaved in the past.
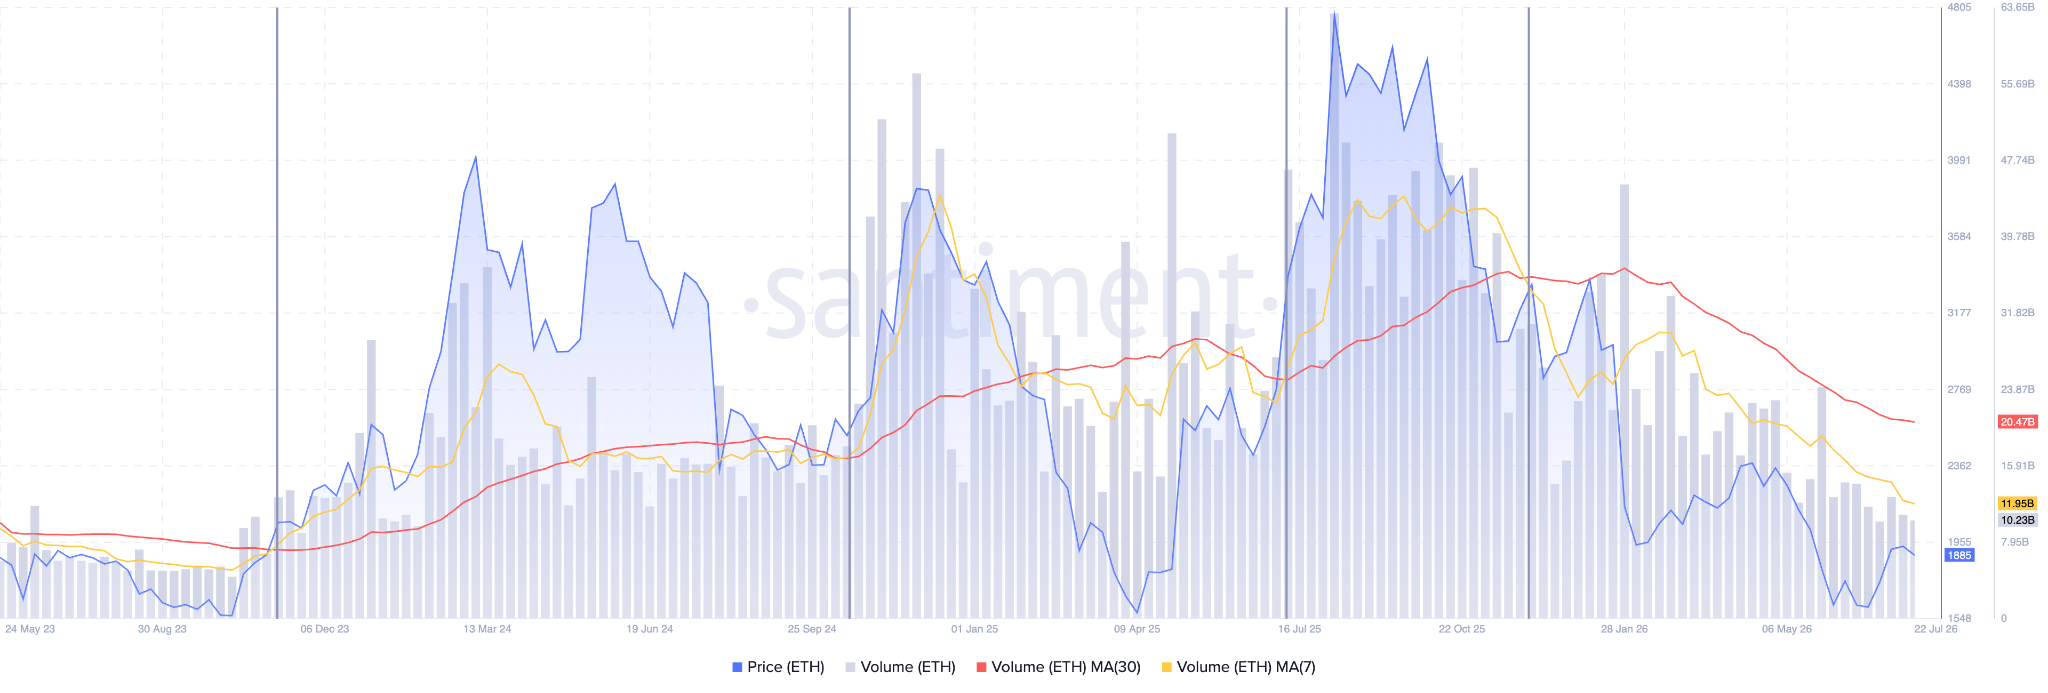
Whenever the 7-day moving average has crossed above or below the 30-day MA, this has marked the beginning of strong bearish or bullish price movements for ETH.
The last time the two lines crossed was in November 2025. Since then, ETH has dropped by 43%.
Right now, the two lines are moving in parallel and have distanced significantly from each other, indicating that volumes have been steadily dropping. Low participation across the spot and futures market reduces the odds of a true recovery.
Hence, although we are seeing some evidence of the beginning of what could be ETH’s recovery, the token could spend a while in consolidation mode before the next bull market begins.
Ethereum Price Forecast
Every new Ethereum analysis as it publishes, today's technical signal and key levels, live price — on one page.
See all Ethereum forecastsOn-Chain Metrics Show Rising Adoption of the Ethereum Blockchain
On-chain data from DeFi Llama shows that Ethereum transactions rose to a new all-time high in April, but the metric has been on a steady downtrend since then, dropping from 72.8 million to 63 million as of last month.
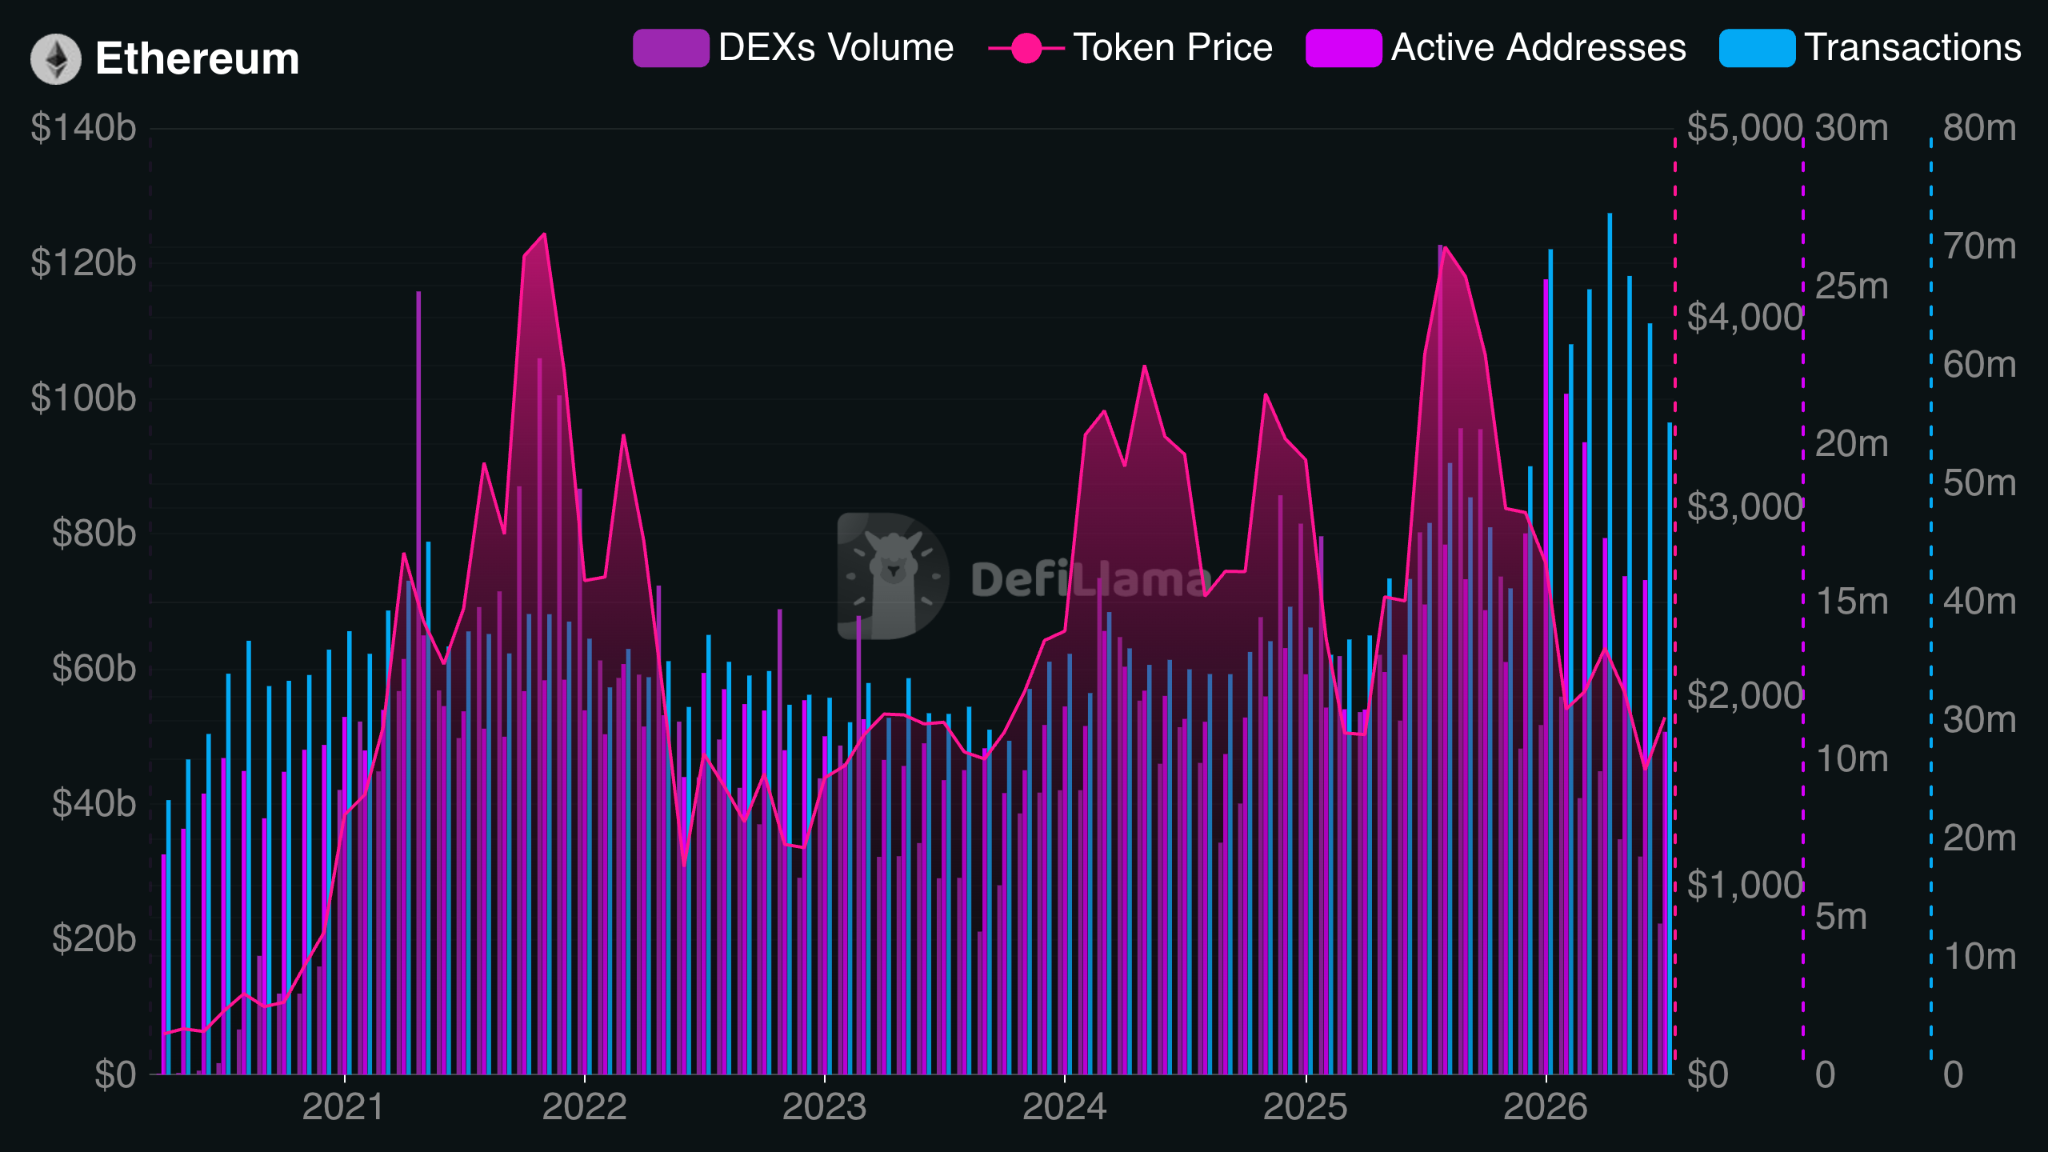
Meanwhile, July’s total transactions seem to be heading to close below that 60 million mark, which would result in the third consecutive monthly drop.
Similarly, daily active users experienced a strong spike in January 2026 and closed at record levels. However, the metric has also been on a downtrend for 6 months in a row.
These depressed on-chain metrics show that network usage has declined. Hence, price action signals have to be interpreted in the context of:
- A challenging macroeconomic backdrop marked by rising rates and geopolitical tensions.
- Depressed on-chain data.
- Thin volumes.
Daily Chart Confirms Bullish Bias – ETH Could Rise to $2.2K
Ethereum’s W-shaped bullish pattern was recently confirmed after the token broke above the $1,800 resistance.
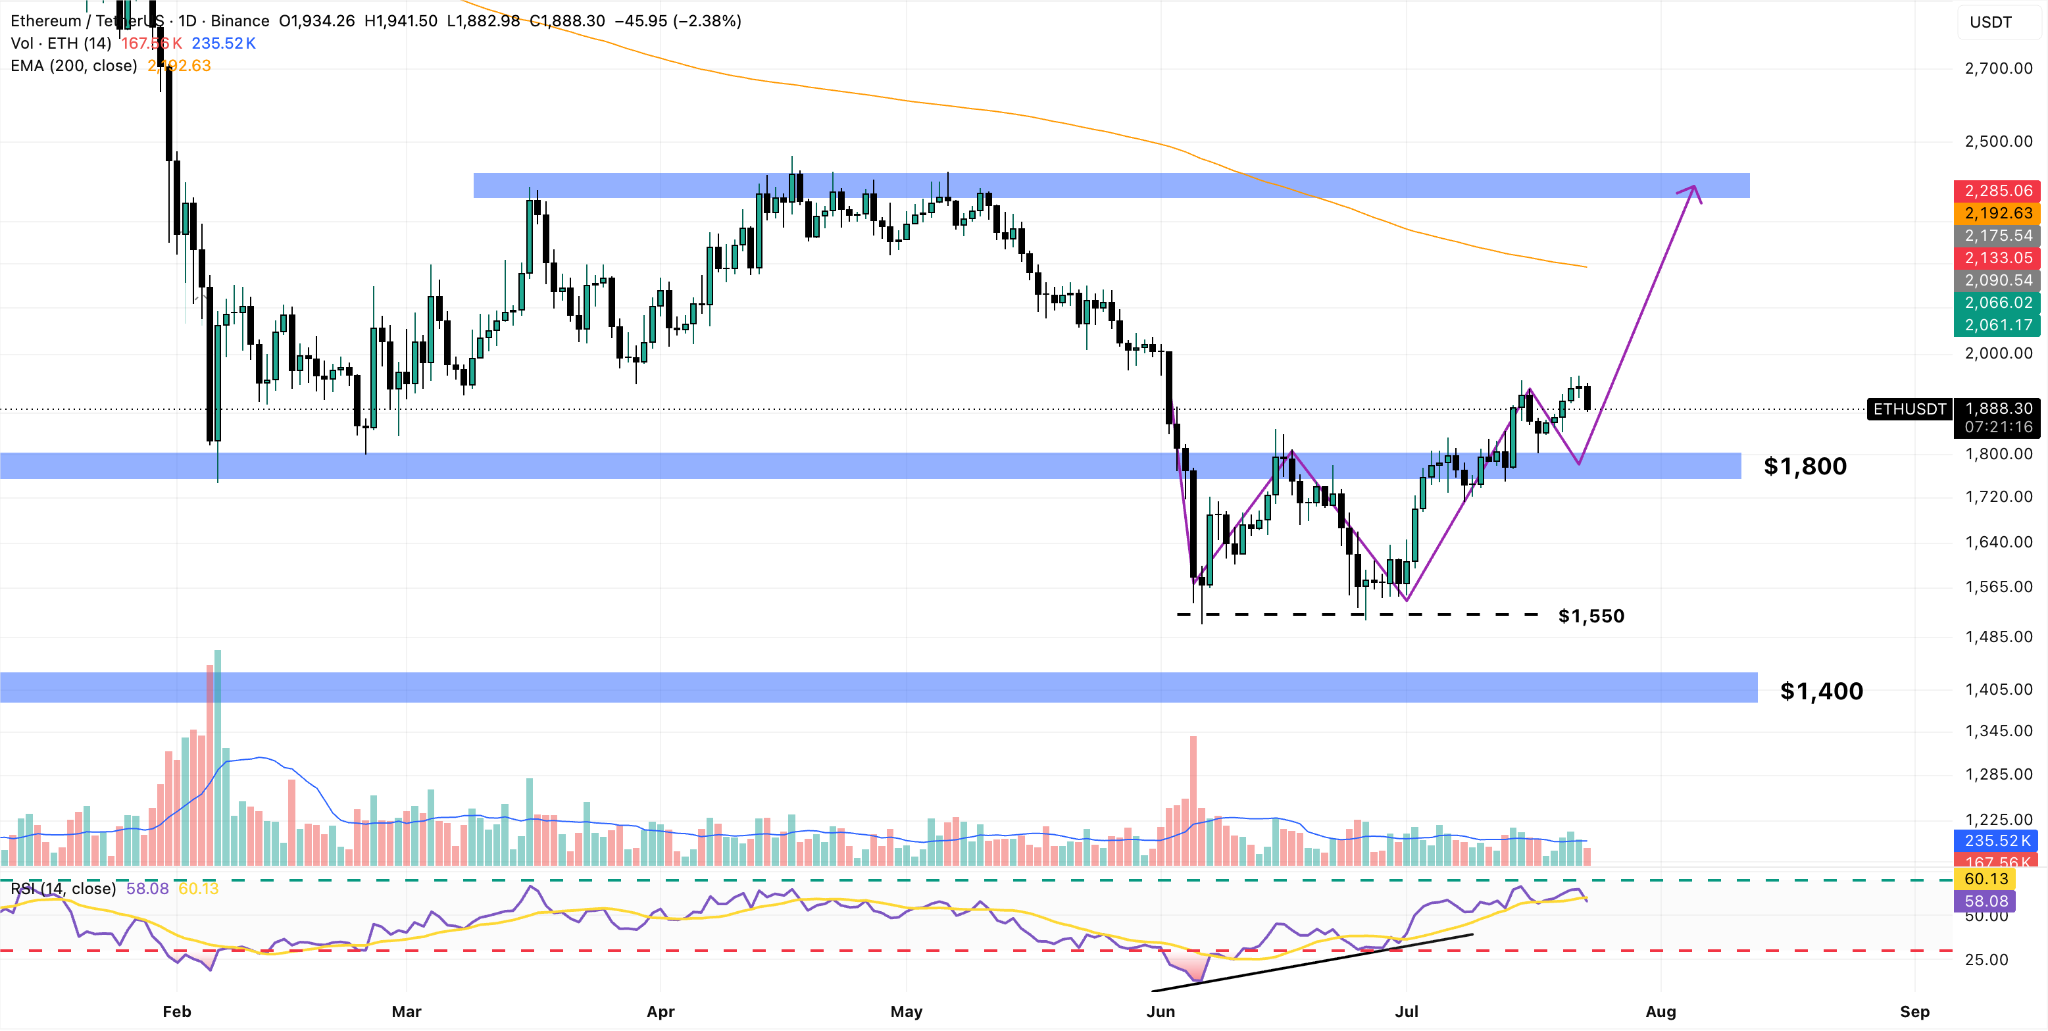
That move confirmed a double-bottom pattern that formed at $1,550 as well, and came after a bullish divergence formed in the daily Relative Strength Index (RSI).
Hence, we have multiple technical markers indicating a short-term moving average. However, in the current context, we see limited upside potential for ETH.
The price would likely rise to $2,200 as part of a reversion to the mean move, as this is where the 200-day exponential moving average (EMA) currently sits. However, the odds that a move above that line will be rejected remain quite high, similar to what happened to Bitcoin (BTC) recently after it tagged that same indicator.



