
Gold Cannot Turn Two Soft Inflation Reports Into a Breakout
Spot gold is higher Friday but the two-month high from Thursday is already behind it. The metal reached $4,493.83, gave back more than $180 to an overnight low at $4,311.04, and is now bouncing somewhere in between.
The payrolls miss, contained CPI and flat PPI all cut into the September hike case, and gold responded by rallying hard into the data. Then sellers showed up because the data was already priced and the next problem was already visible. Washington’s threat of an indefinite naval blockade of Iran gives the oil risk a longer life, and oil with a longer life gives the inflation argument a second chance the July reports just tried to close.
At 11:43 GMT, Spot Gold (XAUUSD) was trading at $4,363.065, up $11.795 or 0.27%.
The bounce off the overnight low at $4,311.04 says buyers are still underneath this market. The failure to hold anywhere near the high says the rate-relief trade has already attracted most of the buying it is going to attract on the current data. Gold needs the next round of inflation numbers to stay friendly, and the blockade threat just made that harder to guarantee.

July’s Inflation Reports Were Friendly but the Next Round Carries the Oil Risk
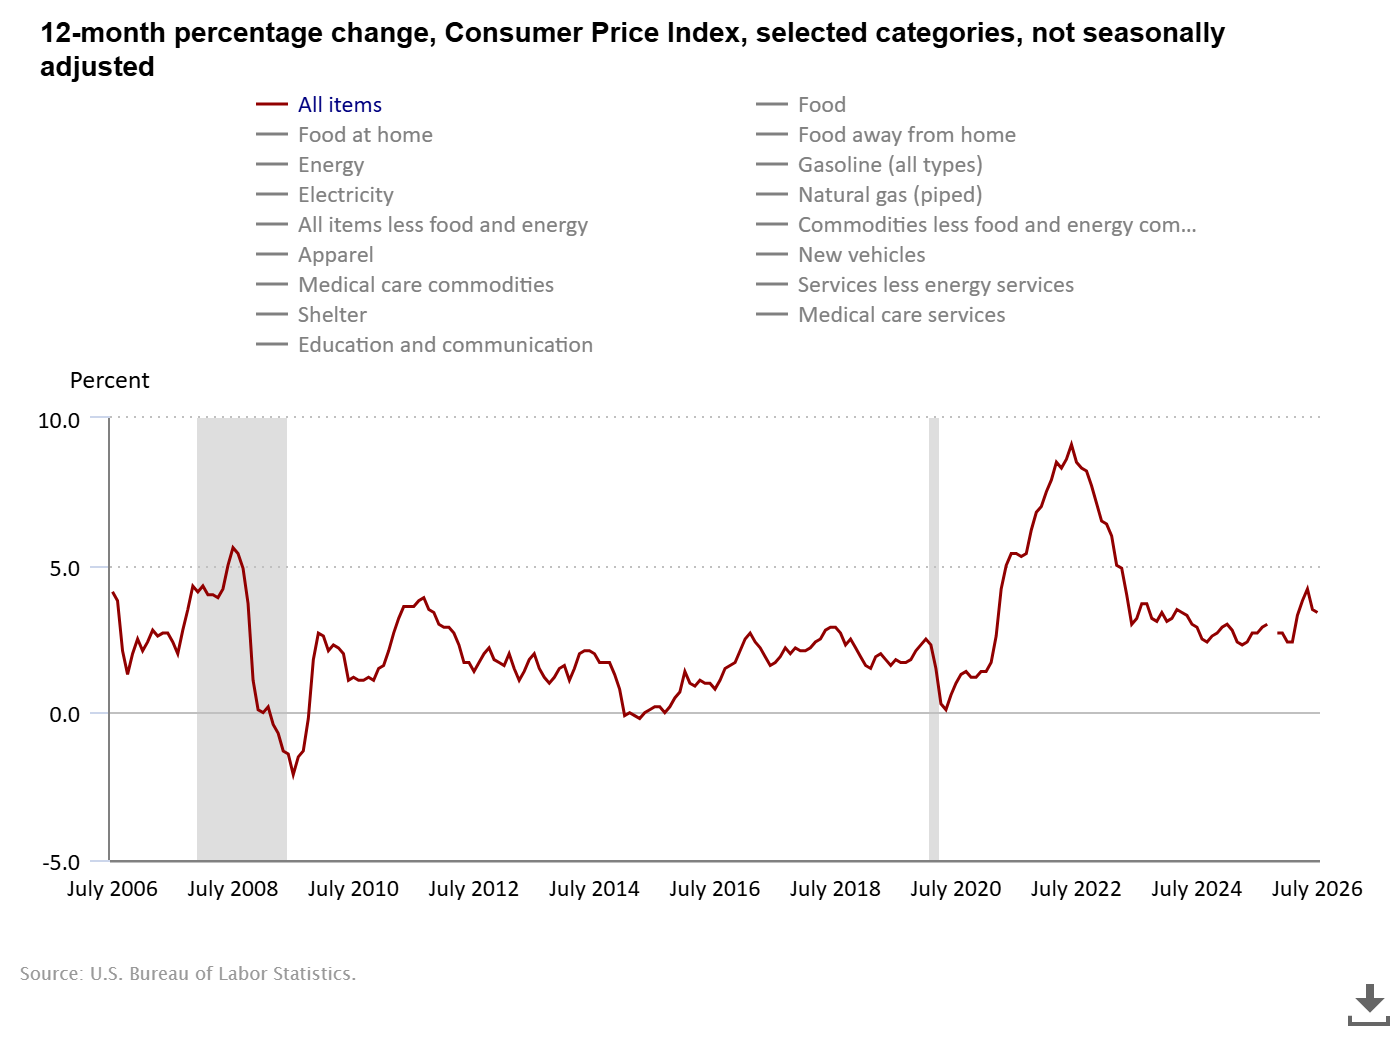
CPI rose 0.1% in July after falling 0.4% in June. The annual rate eased to 3.4% from 3.5%. PPI was flat against expectations for a 0.2% increase, with the annual rate slowing to 4.7% from 5.5% and goods prices falling 0.7% on lower energy. Fed-funds futures now price roughly 67.6% probability of a hold at the September 15-16 meeting, up from worse than even odds a week ago.
That repricing drove the rally. Gold broke to its highest level since June 5 on the back of it. The problem is that PPI data is gathered early in the month and the late-July oil surge was not fully captured in Thursday’s report. Gasoline fell 2.9% in CPI after dropping 9.7% in June, which helped keep the headline contained. That is not a condition traders can assume holds with WTI back above $81 and the strait still restricted.
The July reports tell the Fed what already happened. The August employment and CPI reports that arrive before the September meeting will carry more weight. They have a better chance of capturing the energy move that July missed entirely. PCE is due next and current estimates point to a modest increase with core staying contained. The blockade threat with no end date makes the August collection period the real test. If crude stays elevated, the next inflation prints may not look anything like the ones gold just rallied on.
Gold Price Forecast
Every new Gold analysis as it publishes, today's technical signal and key levels, live price — on one page.
See all Gold forecastsThe Dollar Held Firm and Gold Paid for It
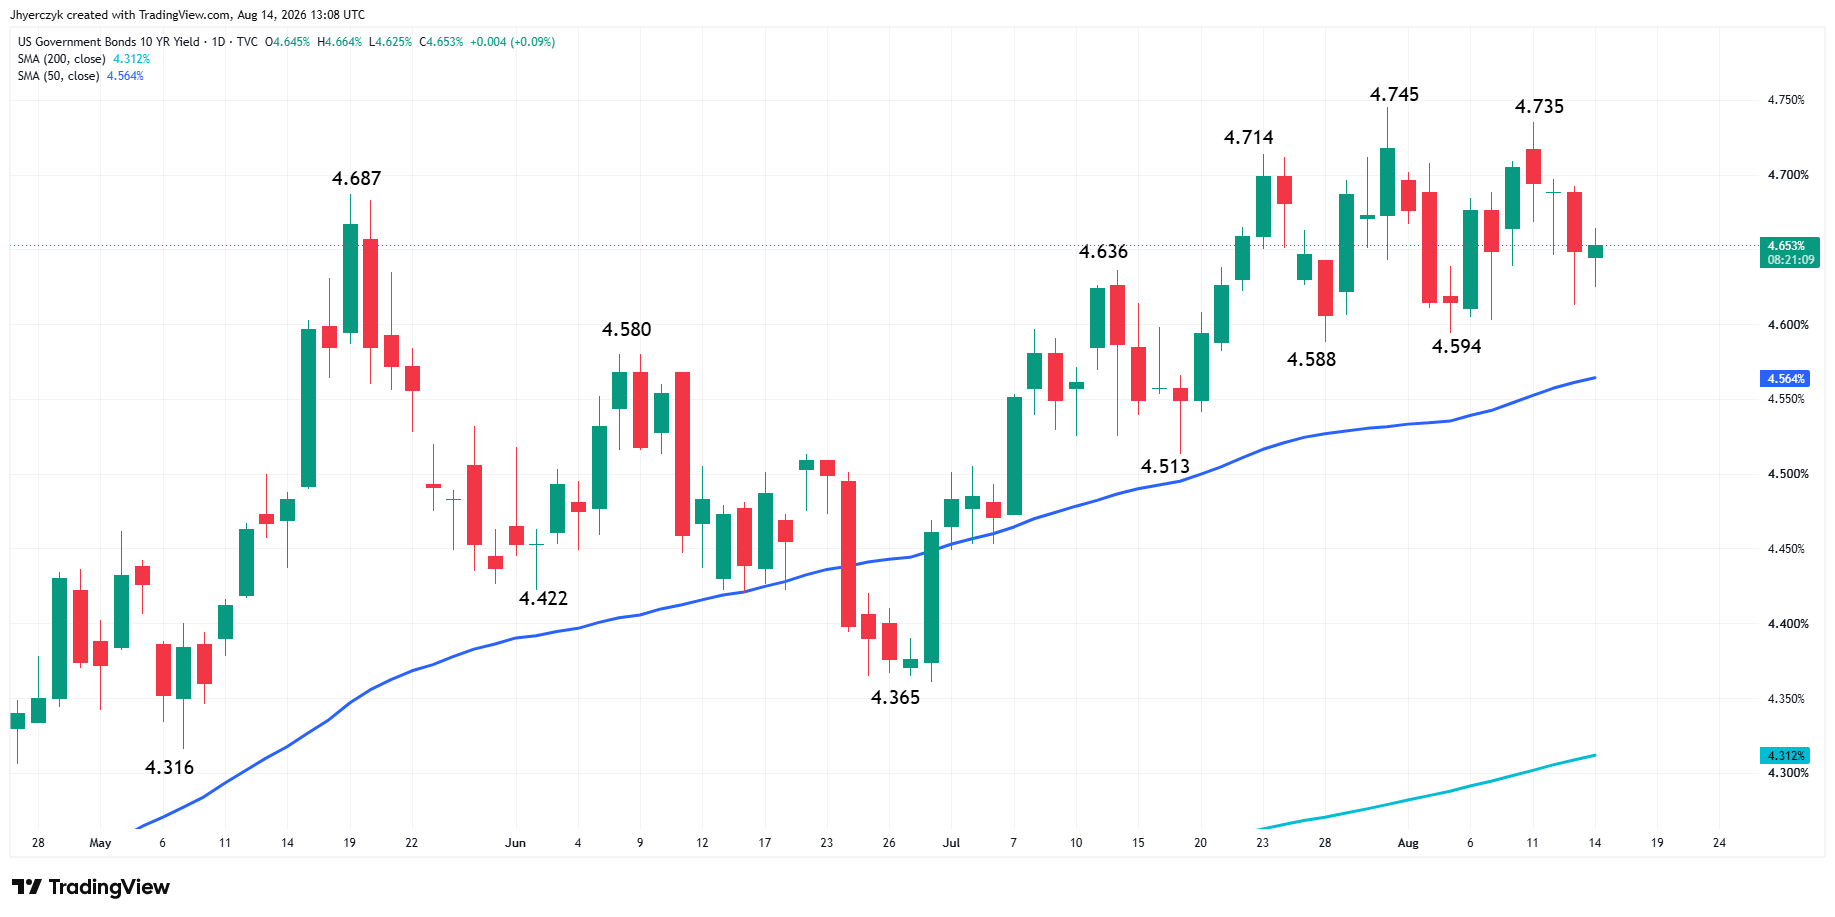
Treasury yields dropped after PPI Thursday and came back Friday. The 10-year rose to 4.661%, the two-year moved to 4.152% and the 30-year climbed to 5.237%. The bond market treated PPI as another reason to cut hike odds. Then the blockade threat shifted the focus back to oil and what energy does to the next inflation print, and yields started moving the other way.
Gold reached its high with yields falling. It sold off when yields stabilized and the dollar held firm. The bond market cooperated. The currency market did not, and a rally that runs on one without the other keeps hitting a ceiling. The 67.6% hold probability is a significant shift from last week. The Fed is still split, with some officials pointing to weaker payrolls and contained July data while others have inflation above 2%, real yields elevated and an energy conflict that can reprice crude in a single session.
Daily Spot Gold (XAUUSD) Technical Analysis
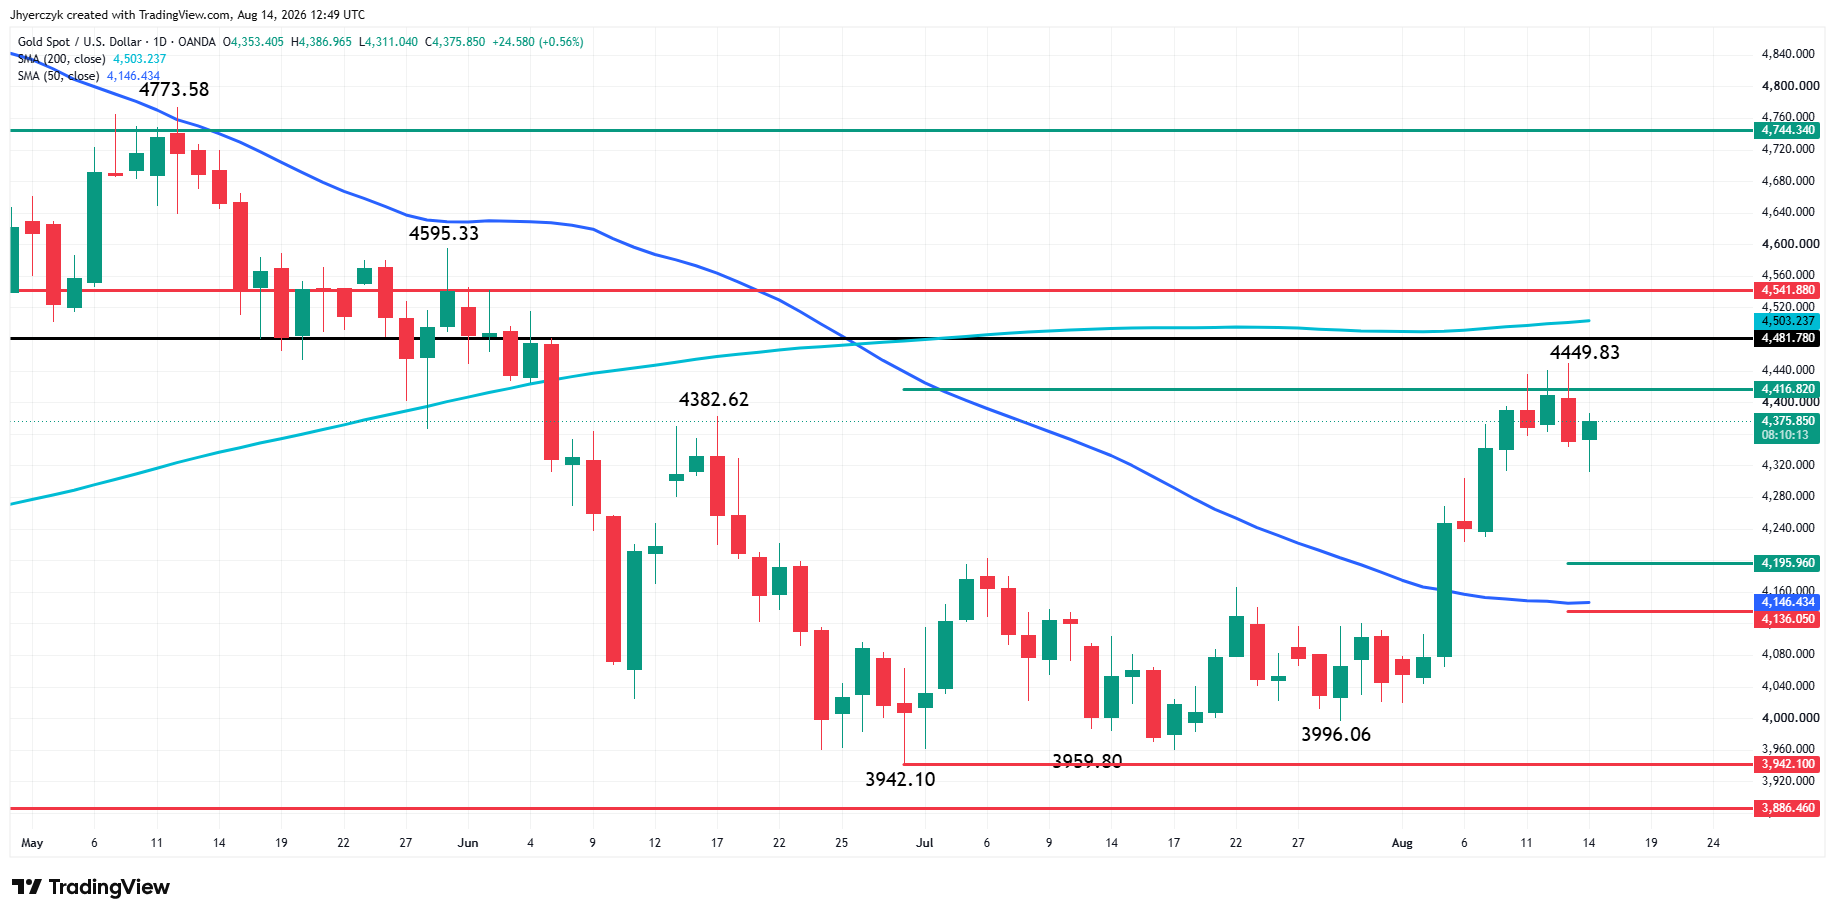
Spot Gold is putting in a mixed performance early Friday as traders weigh soft inflation against potential oil risk. That gives traders the choice to aggressively take out offers or passively bid at lower prices.
Overnight, spot gold hit an intraday low at $4311.04 before rebounding to the high of the session at $4368.28. This could be an early sign that traders have shifted to buy-the-dip mode.
If traders decide to aggressively take offers, the market has room to run to 50% resistance at $4416.82, followed by $4481.78, the new main top at $4493.83 and the 200-day moving average at $4503.19.
The potential resistance at $4481.78 is interesting because it represents 20% down from the all-time high. Some chart-watchers consider this to be the price level that started the bear market.
On the downside, the market remains vulnerable to a sharp correction despite the change in trend on the swing chart. Spot gold recaptured the 50-day moving average at $4146.34 and nearly touched the 200-day moving average at $4503.19. The main target area on the downside is the retracement zone at $4195.96 to $4136.05.
What to Watch
Gold has the better rate backdrop heading into the weekend. The payrolls miss started the shift. CPI did not reverse it. PPI reinforced it. Hold odds near 68% are a real change from where the market stood seven days ago. The two-month high and the $180 reversal off it tell you the market priced most of that improvement and then ran into selling from traders who see the oil risk ahead. The blockade threat, restricted Hormuz traffic and stalled talks are not going away over the weekend, and if crude opens higher Monday the inflation argument that two soft reports just weakened starts rebuilding immediately.
The swing chart trend turned up this week but gold nearly touched the 200-day moving average at $4,503.19 and could not hold the move. The overnight low at $4,311.04 and Friday’s bounce off it suggest buyers are shifting to a dip-buying posture. The retracement zone near the 50-day moving average at $4,146 is where the correction finds real support if selling extends. The distance between that zone and the 200-day defines the range until the next catalyst picks a direction.
If you’d like to know more about how to trade gold, please visit our educational area.