
Gold Forecast Video for 03.08.23 by Bruce Powers
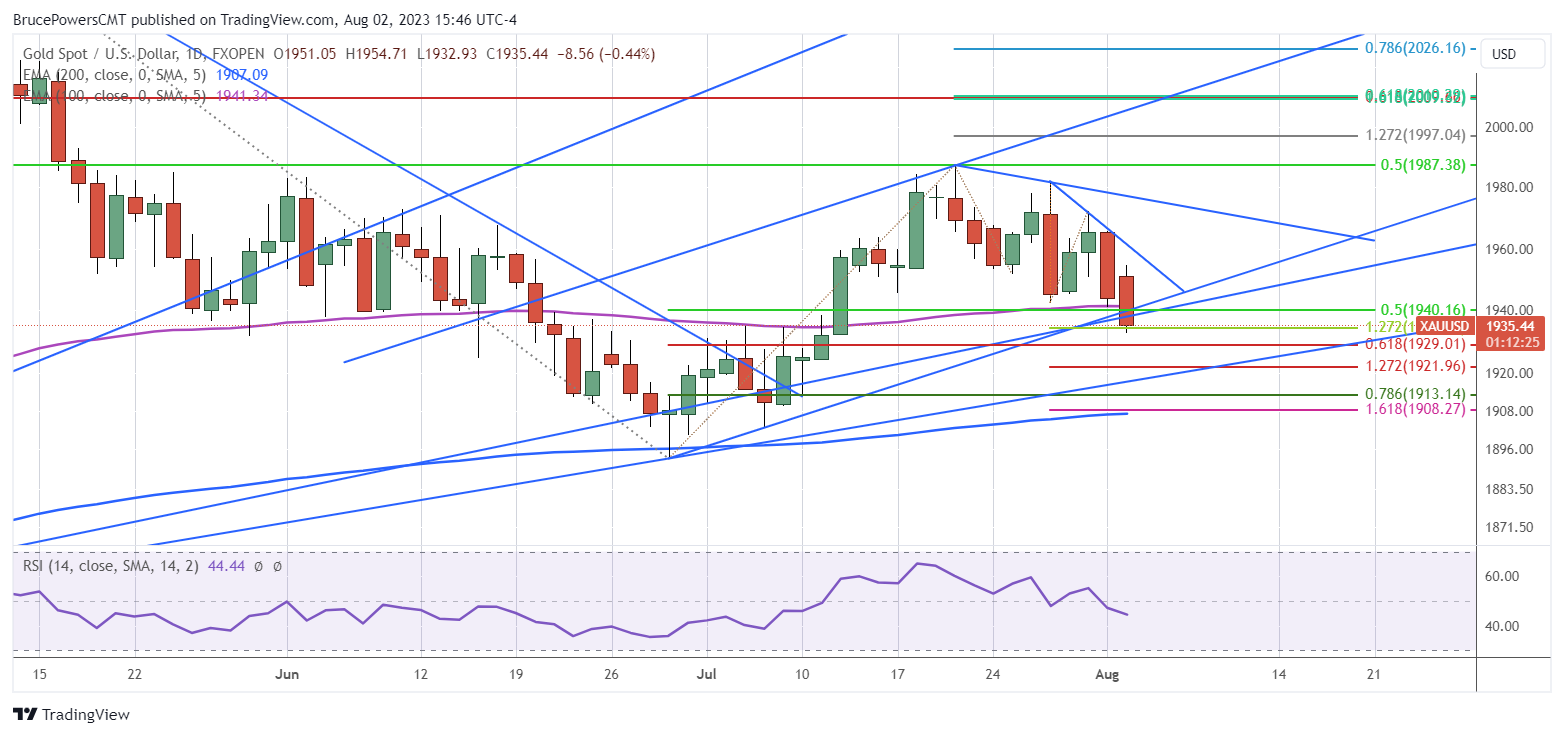
Gold dropped through yesterday’s low of 1,941 on Wednesday along with the 100-Day EMA (purple), before reaching a low of 1,933. Moreover, each of the two internal trendlines marking potential support have been busted to the downside. A daily close below approximately 1,938 confirms the bearish move and opens the door to further selling.

Critical Support at 200-Day EMA and 1,893 Swing Low
Critcal support is around the 200-Day EMA, now at 1,907. Support around the 200-Day line was tested a couple times since the price of gold rose above it last November. As noted, today’s decline put gold below its 100-Day EMA, and it is set to close below it as well as below the internal uptrend lines. Before gold can reach possible support of the 200-Day line it has the longer-term uptrend line to consider on the way down. Nevertheless, a 61.8% Fibonacci retracement level is at 1,929. That’s the next lower potential support area. The 1,893-swing low from June should not be busted to the downside. Once that happens the price structure of the uptrend needs to be reworked.
Gold Fell Sharply Through Key Price Levels
Gold fell sharply through the potential support levels noted above and is set to close with a long red candlestick pattern showing the bears in charge. Today’s close will likely be in the lower 25% of today’s price range, which is bearish and points to a deeper correction before completion. A move back above the 100-Day EMA and subsequent close above it will provide signs of strength. These signs need further confirmation as we move forward. Critically, a daily close above today’s high of 1,955 shows signs of a daily bullish reversal. Last week’s high of 1,972 should also be watched as a rally above it shows strength. A daily close above the weekly high will confirm a weekly bullish reversal.
Potential Three-Drives to a Bottom Pattern
As mentioned yesterday, gold is displaying a potential three drives to a bottom bullish reversal pattern. Today’s low of 1,933 completed a 127.2% Fibonacci extension (1,934) of the two-day rally from last week, while the previous short-term rally also retraced 127.2% of the prior minor advance.
For a look at all of today’s economic events, check out our economic calendar.