



Gold Forecast Video for 05.02.24 by Bruce Powers
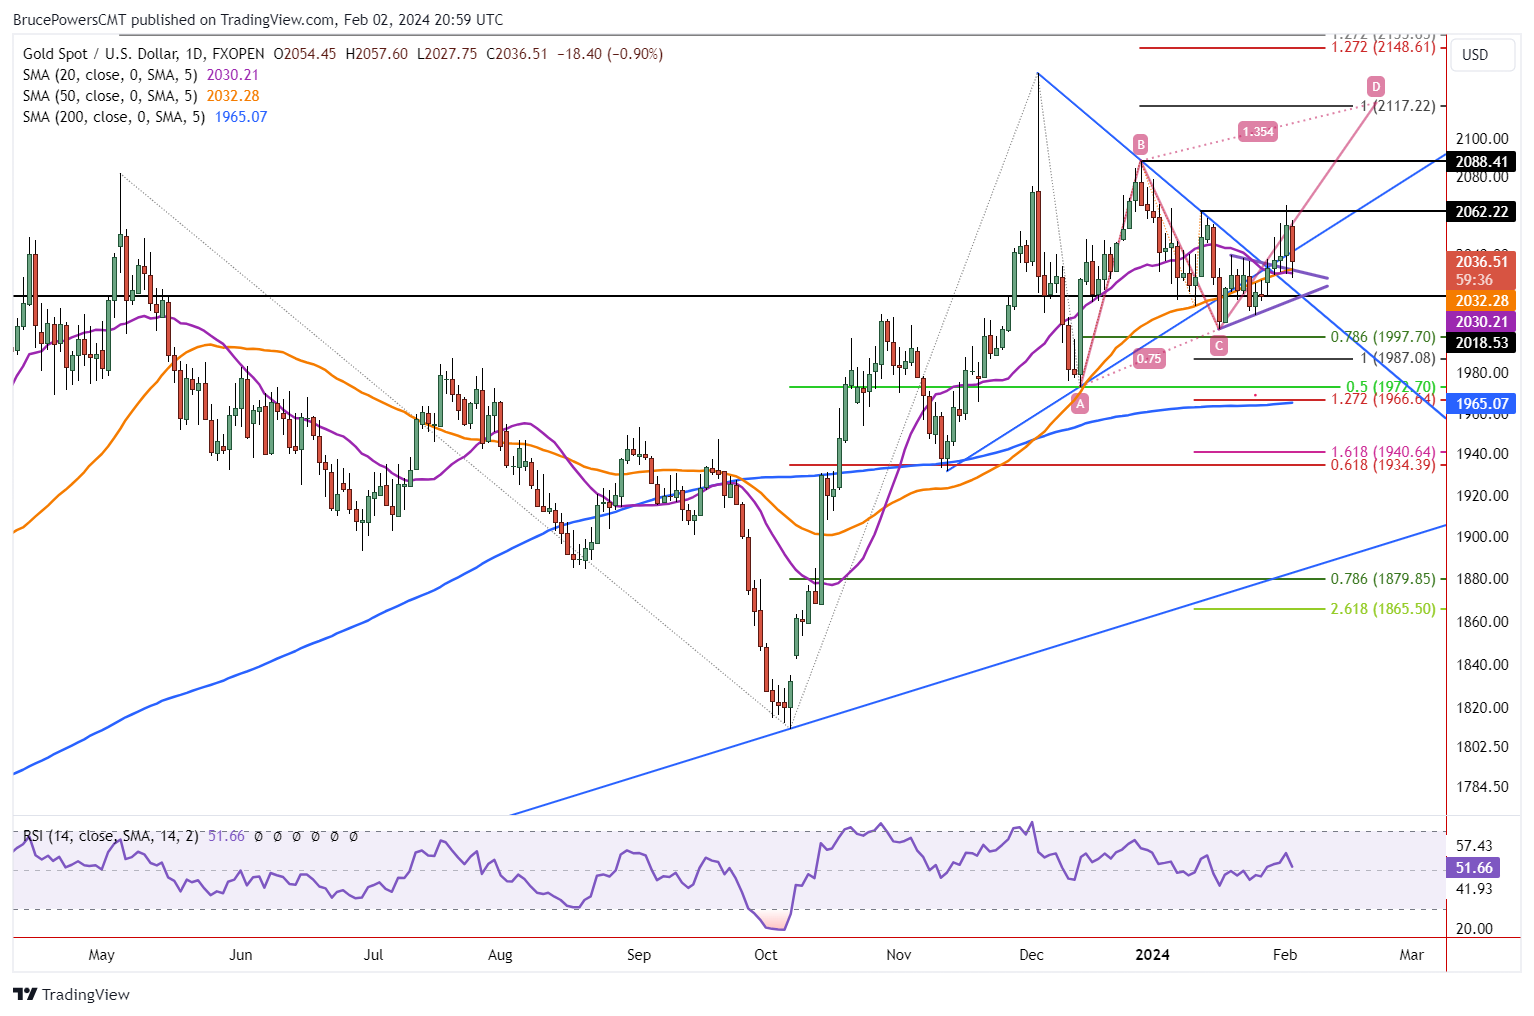
Gold failed to follow through to the upside on Friday following a bullish breakout earlier in the week. The advance triggered a breakout of a small pennant consolidation pattern, a breakout of the downtrend line, as well as both the 20-Day (purple) and 50-Day (orange) MAs. However, follow through is key and that did not occur today. Instead, gold tested support with a four-day low of 2,028. That’s the lowest traded price since the breakout triggered on Tuesday.

Weak Price Action Holds Above Key Support
Nonetheless, although Friday’s price action was weak, gold did hold support around the breakout area. If it continues to do so the breakout remains valid with expectations for a continuation higher. Key trend support is around the 50-Day MA at 2,032. The area of the 50-Day line has been successfully tested as support over the past few weeks, and again today.
This Week Rally Above 2,062 Shows Underlying Strength
The first higher target, at the swing high of 2,062, was exceeded slightly on Thursday, before the sellers took control during Friday’s session. That move showed strength as the swing high is part of the price structure of the downtrend and it was violated. This is a sign of underlying strength. Regardless, gold has not moved much above the 50-Day line. Since it was tested again today, there is a chance that it can continue to be tested, in which case it may fail. That doesn’t seem to be the most likely scenario, but it remains a possibility.
Weekly Chart Shows Challenge
Gold also triggered a bullish reversal on the weekly chart this week on a move above January’s high of 2,038. It is supportive of higher prices. But the breakout is not yet confirmed on that time frame until there is a weekly closing price above January’s high. At the time of this writing gold is trading slightly below that price level.
Higher Targets
An advance above this week’s high of 2,065 generates a bullish signal with the next higher target around the swing high at 2,088 (B). If exceeded, gold heads to the target for a rising ABCD pattern at 2,117. Such a move would put it very close to the record high of 2,135 seen last October.
For a look at all of today’s economic events, check out our economic calendar.


