



Gold futures are edging lower on Wednesday shortly before the release of the minutes from the U.S. Federal Reserve’s latest policy meeting at 19:00 GMT. With most of the major players sitting on the sidelines, gold prices are being capped by a stronger U.S. Dollar, while a dip in Treasury yields may be preventing even lower prices.
At 17:28 GMT, April Comex gold futures are trading $1841.60, down $0.05%. The SPDR Gold Shares ETF (GLD) is at $170.45, down $0.17 or -0.10%.
Traders are hoping the Fed will offer more clarity on the U.S. central bank’s rate-hike path. To recap the Jan. 31-Feb. 1 meeting, the Fed raised rates by 25 basis points and the market predicted one more 25 basis point rate hike in March with the Fed funds rates coming in at 4.91%.
However, recent strong U.S. economic readings have raised bets for more rate hikes from the Fed, pressuring gold prices which have fallen 4.7% so far this month. Traders are now pricing in more Fed rate hikes until about June, with a peak seen at 5.35% in July.

Hawkish Minutes Could Crush Gold Prices
The recent price action suggests gold traders have priced in at least three 25-basis point rates in March, May and June. However, there is some chatter that a 50-basis point rate hike in March is back on the table.
St. Louis Fed President James Bullard said on Wednesday that the Fed needs to get inflation onto a sustainable path this year or else risk a repeat of the 1970s, when interest rates had to be repeatedly ratcheted up. Bullard is one of the Fed members who suggested a 50-basis point rate hike.
Gold prices could see a steep sell-off if the minutes show that several members had discussed the case for a 50 basis point rate hike.
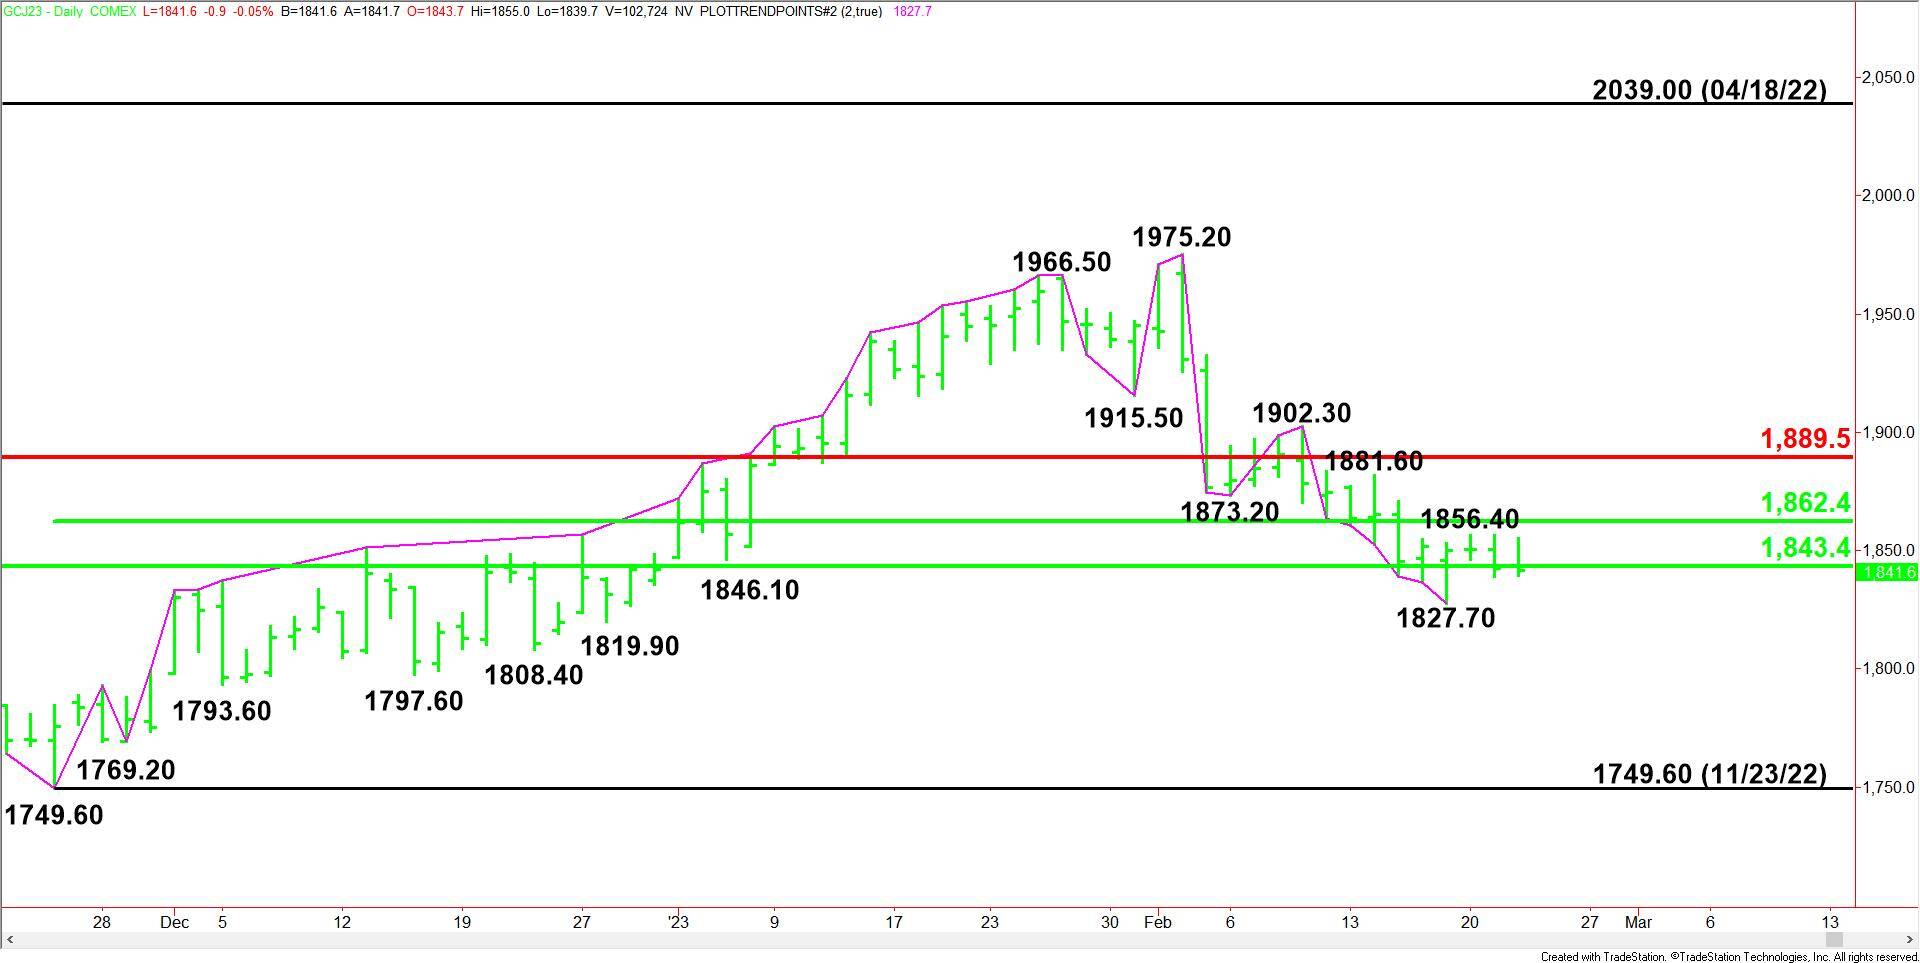
Daily April Comex Gold Technical Analysis
The main trend is down according to the daily swing chart. A trade through $1827.70 will signal a resumption of the downtrend. A move through $1975.20 will change the main trend to up.
The minor trend is also down. Taking out $1856.40 will change the minor trend to up. This will also shift momentum to the upside.
The market is currently straddling a major 50% level at $1843.40. Trader reaction to this level will determine the longer-term direction of the precious metal.
On the upside, the nearest resistance is a short-term 50% level at $1862.40, followed by a long-term Fibonacci level at $1889.50.
Daily April Comex Gold Technical Forecast
Trader reaction to $1843.40 is likely to determine the direction of April Comex gold into the close on Wednesday.
Bearish Scenario
A sustained move under $1843.40 will indicate the presence of sellers. If this creates enough downside momentum then look for the selling to possibly extend into the minor bottom at $1827.70. Taking out this level could trigger an acceleration to the downside, or a steady sell-off due to a number of minor bottoms. However, the objective of $1749.60 remains intact.
Bullish Scenario
A sustained move over $1843.40 will signal the presence of buyers. This could trigger a surge into a resistance cluster at $1856.40 – $1862.40. The latter is a potential trigger point for an acceleration into another resistance cluster at $1881.60 – $1889.50.


