



Highlights
- Gold stable as Fed impacts Treasury yields, dollar
- Global central banks, U.S. data sway gold trends
- XAU/USD reacts to economic uncertainty, Fed’s outlook
Gold Nearly Flat as Fed Influences Yields and Dollar
Gold (XAU/USD) is showing little change early Monday, trading at $2024.33, as traders consider the impact of the Federal Reserve’s recent policy shift on Treasury yields and the U.S. Dollar, alongside assessing recession risks for 2024.

Fed’s Influence on Market Dynamics
The Fed’s dovish pivot is a key factor influencing both U.S. Treasury yields and the dollar’s strength, which in turn affects gold prices. While market activity is expected to slow down heading into the Christmas holiday, key economic reports such as the U.S. Core PCE Price Index, Final GDP, and consumer sentiment data, as well as the U.K.’s CPI and Retail Sales figures, are anticipated to provide further direction.
Global Central Banks and U.S. Economic Data
In addition to the Fed, the Bank of Japan’s policy meeting this week, where a shift from negative interest rates is on the table, is drawing attention. U.S. economic indicators, particularly the core PCE index report, are watched for clues on inflation trends and potential Fed actions.
Gold Prices Amid Economic Uncertainty
Gold prices are currently hovering around $2024.33, reflecting the market’s balancing act between the Fed’s dovish signals, fluctuating Treasury yields, and a shifting dollar. These factors, coupled with global central bank policies and upcoming economic reports, are key to determining gold’s short-term movement.
Short-Term Outlook for Gold
In the near term, gold’s direction will likely be shaped by the interplay of the Fed’s rate expectations, Treasury yield trends, and dollar fluctuations, against a backdrop of global economic data. Traders should remain vigilant to these influences to gauge gold’s trajectory.
Technical Analysis
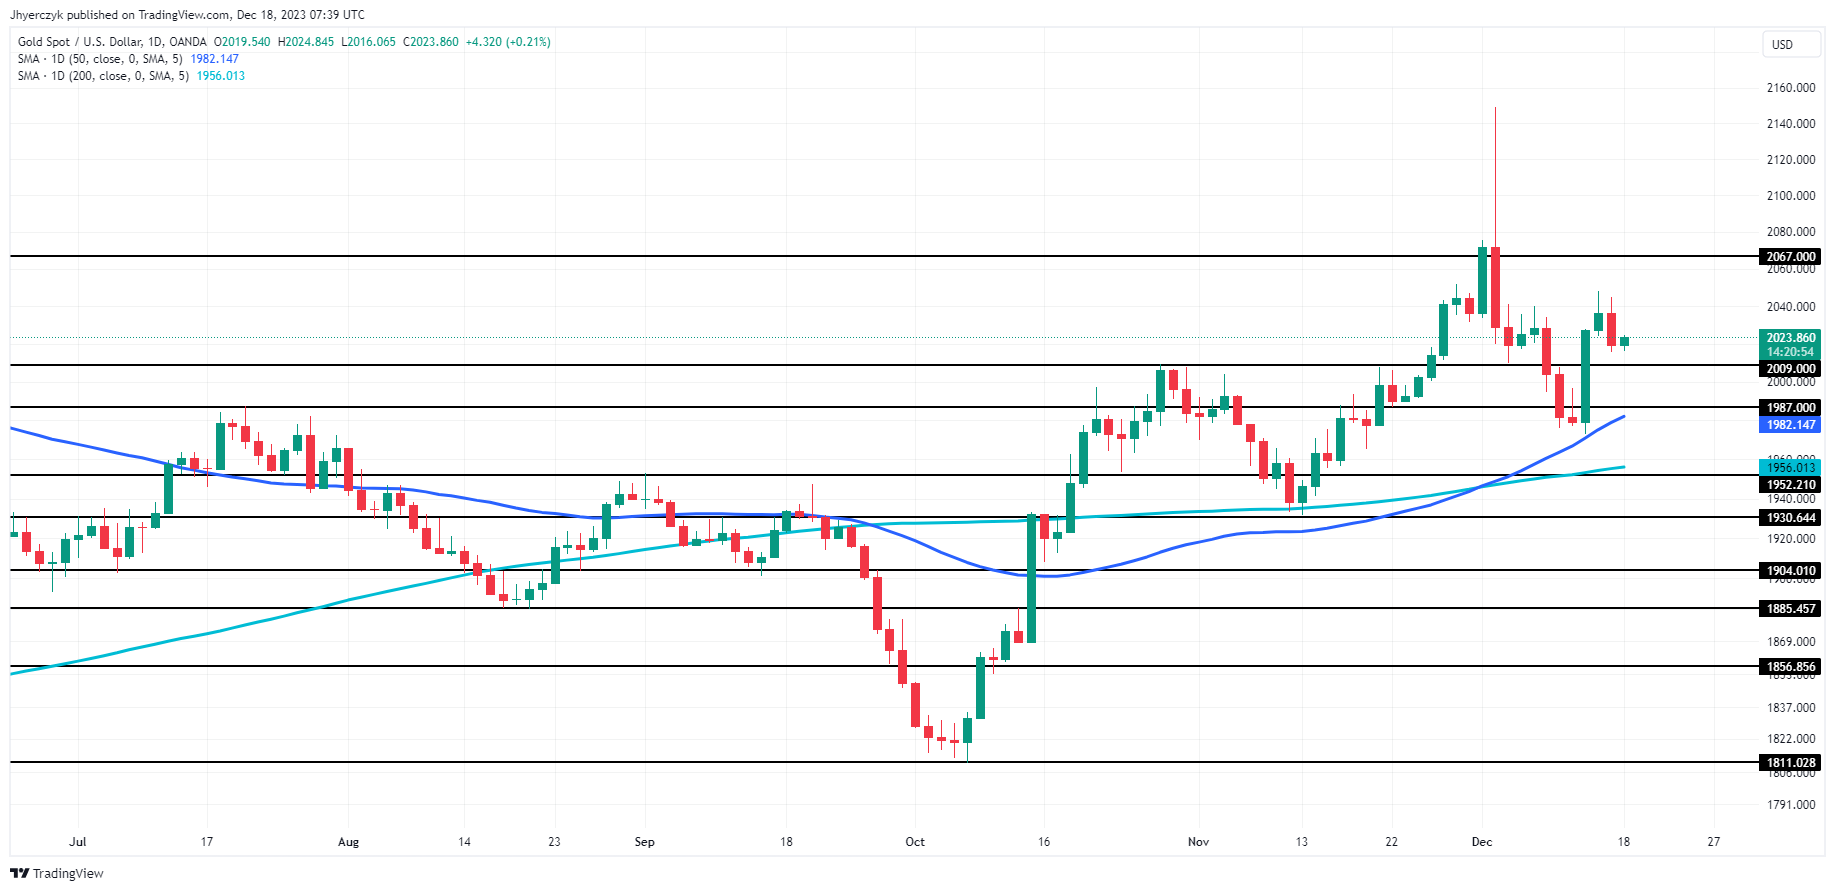
Gold (XAU/USD), currently trading at 2023.92, is showing a cautious upward movement as it sits above both the 200-day and 50-day moving averages, which are at 1956.01 and 1982.14 respectively. This positioning above the moving averages typically suggests a bullish trend in the medium to long term.
However, the price is hovering near the minor support level at 2009.00, indicating potential volatility and the need for close monitoring. The presence of main resistance at 2149.00 and minor resistance at 2067.00 sets clear benchmarks for further bullish momentum.
Overall, the market sentiment leans towards bullish, but with a note of caution due to the proximity of the support level and potential resistance challenges ahead. Relatively low volume could also be influencing the price action.


