Breakout Momentum Fades
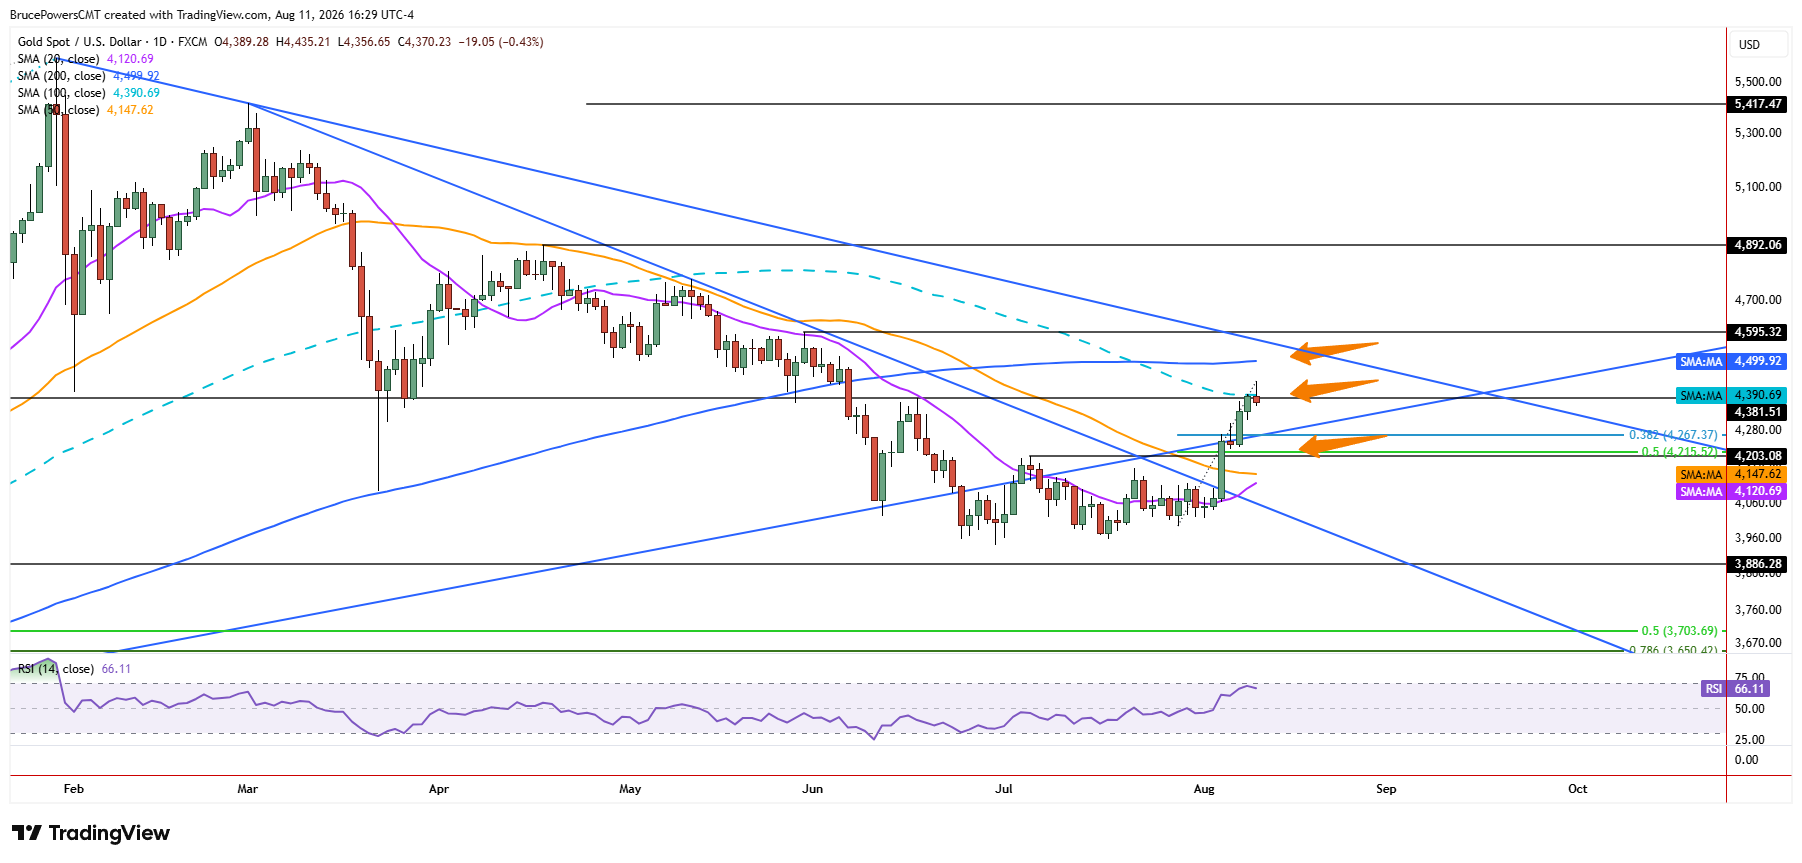
Gold extended its advance to a new high of $4,435 during Tuesday’s session, following Monday’s breakout above a key resistance zone. However, the strength of Tuesday’s advance was not sustained as sellers took back control and drove price into the lower range of the day, where it remained at the time of writing. This initial failure to hold the breakout further validates the resistance zone, at least for the short-term, and raises the possibility of a near-term pause or pullback.

Resistance Confluence
The lower swing high of $4,382 from June marks the resistance zone, which was first indicated previously beginning with the October 2025 peak and subsequently confirmed by the spike low in early February. Notably, the 100-day moving average, near $4,390 currently, also reinforces the resistance zone, with the average nearly coinciding with the June swing high. This confluence suggests that resistance may continue to hold for now, particularly given Tuesday’s failure to retain its initial advance and the potential for a close in the lower half of the day’s range.
$4,357 Line in the Sand
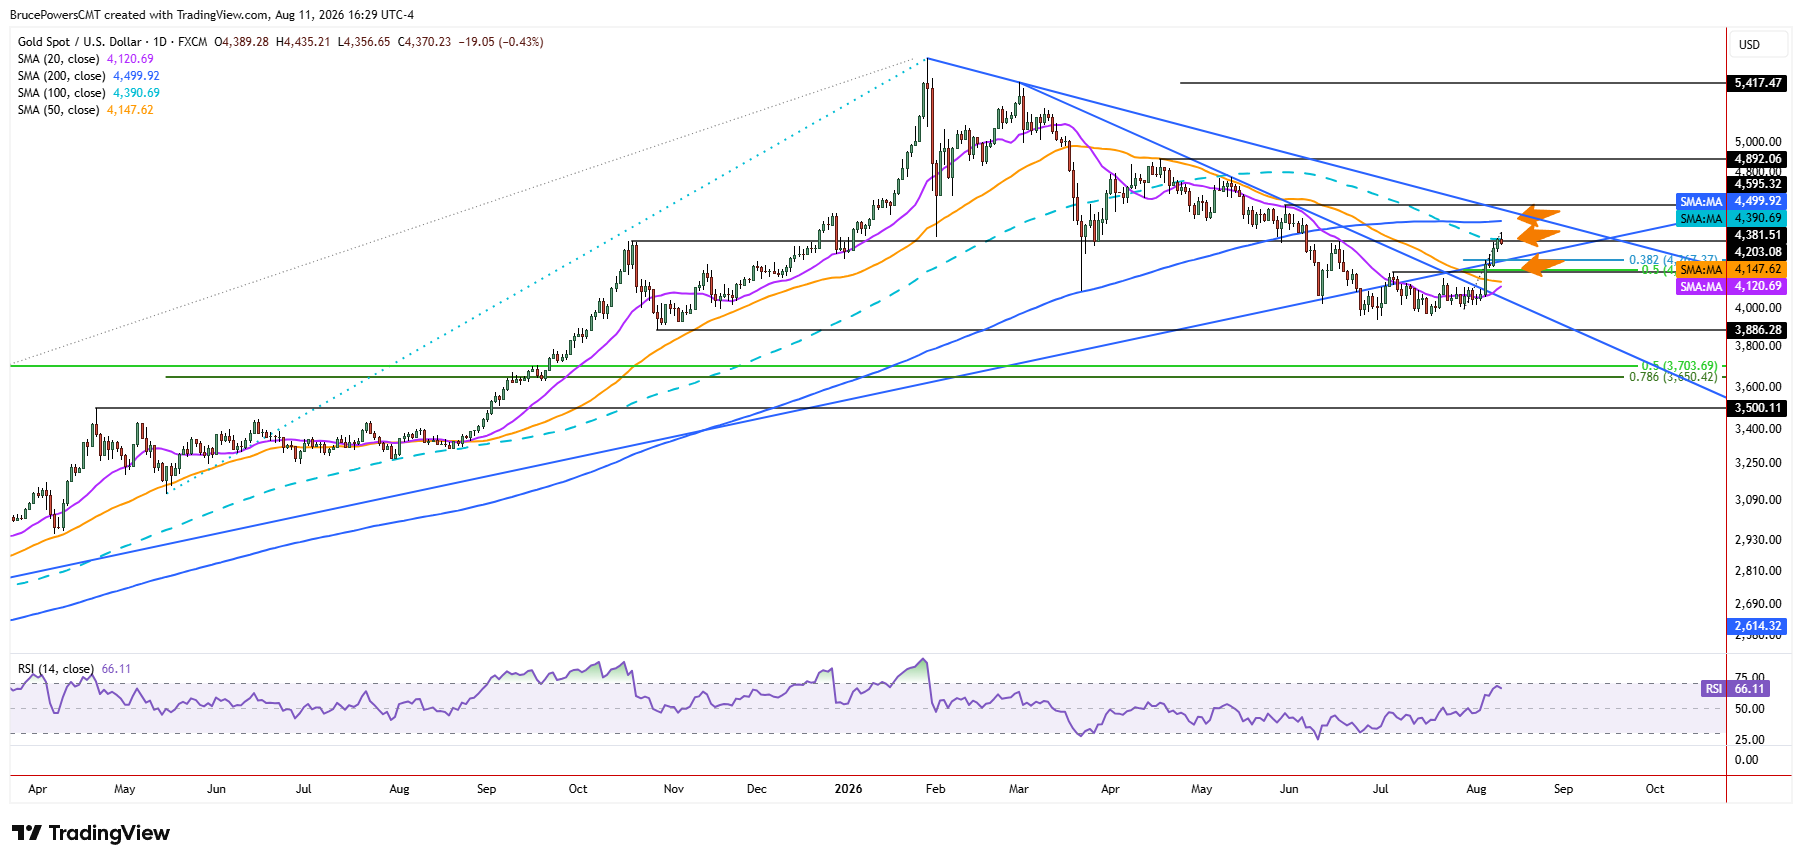
A new higher daily low of $4,357 is now key near-term support, since a drop below it may lead to a deeper pullback. However, an eventual recovery and continuation of the short-term bull trend still look likely after a period of consolidation or correction. Monday’s breakout above the lower swing high of $4,382 was confirmed when the session ended above that level, with a close at $4,389. That provided a trend reversal signal and helped establish the bullish momentum that carried into Tuesday’s advance.
Since bullish momentum began following a declining trendline breakout last Wednesday, gold had advanced by approximately 8.0% from last Wednesday’s low to Tuesday’s high. That is a relatively healthy move in a short period of time. Therefore, some degree of correction, either through consolidation or a pullback, could be healthy for the advance before gold is ready to proceed higher. A break below $4,357 would increase the likelihood of that deeper correction, while holding above support would keep the bullish structure intact.
$4,500 Above, $4,267 Below
Nonetheless, the next upside target is marked by the 200-day moving average near $4,500. A decisive breakout above Tuesday’s high would signal a continuation of the short-term advance toward the next target, which is less than 2.0% above the high.
Gold Price Forecast
Every new Gold analysis as it publishes, today's technical signal and key levels, live price — on one page.
See all Gold forecastsIf $4,357 support breaks, the 38.2% Fibonacci retracement of the prior advance is at $4,267 presents a possible minimum retracement target. It takes on added significance from its proximity to the long-term rising trendline and last Wednesday’s high of $4,268. Holding $4,357 would preserve the bullish setup and leave the door open for another test of $4,500, while a break below it would point to a deeper retracement toward $4,267.
If you’d like to know more about how to trade gold and silver, please visit our educational area.