


Gold Finds Its Footing Above the 20-Day Average
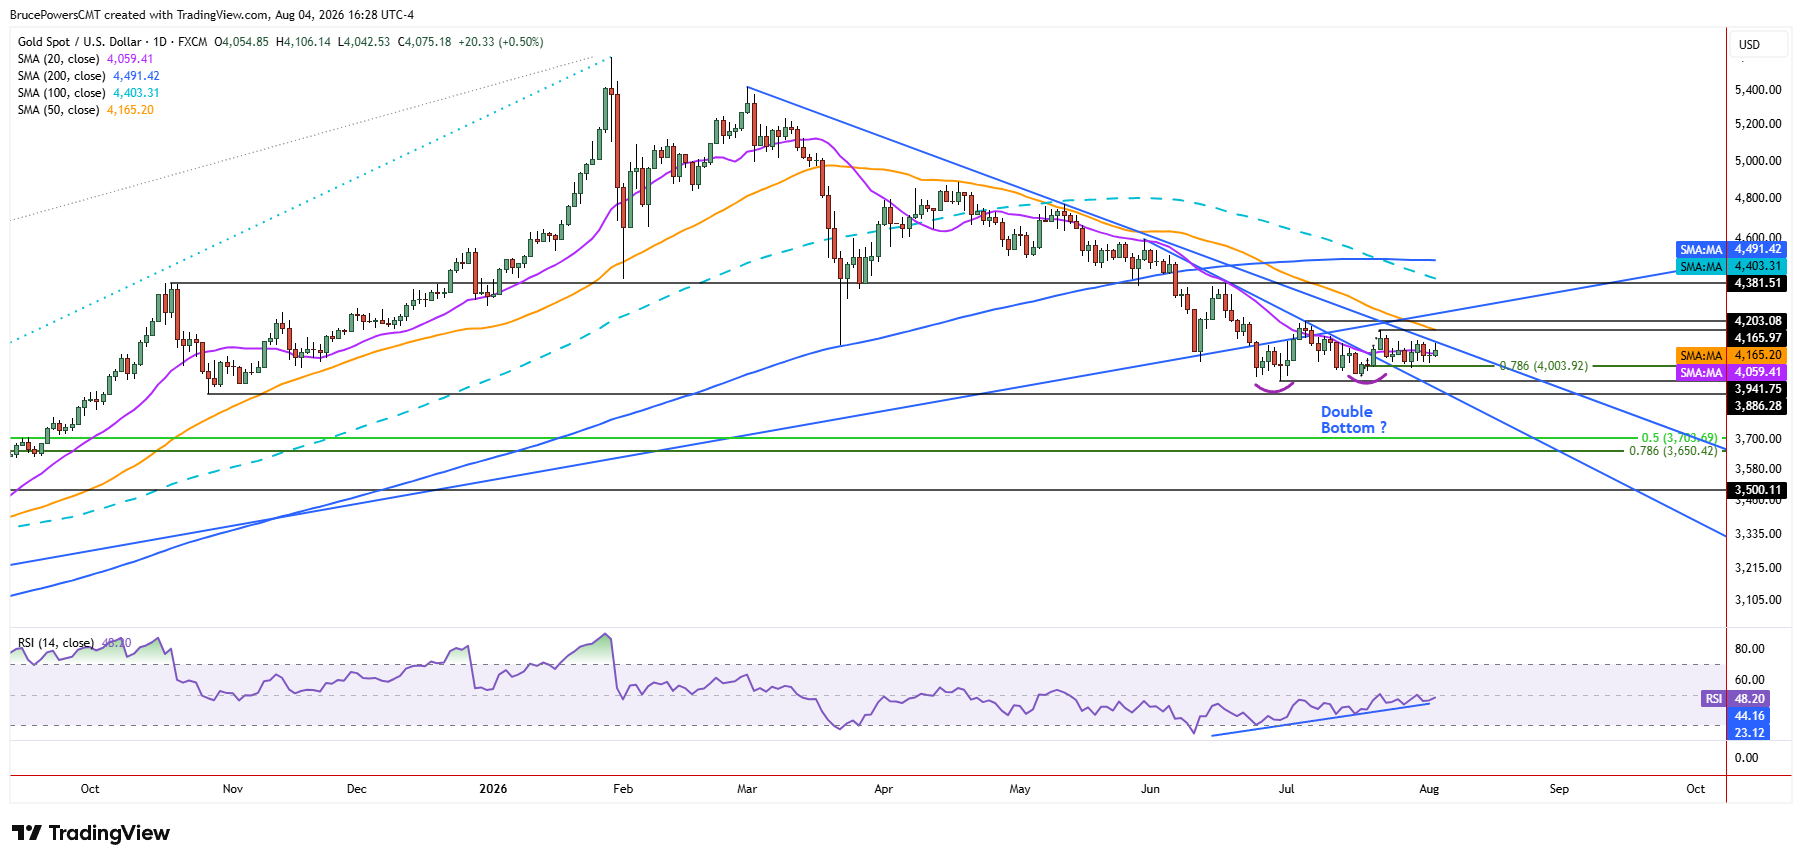
Although gold remained inside a small price range on Tuesday, signs of strength were seen as it established a higher daily high and low and closed above the 20-day moving average near $4,060. Gold has been attempting to reclaim the 20-day moving average during the short consolidation period since a breakout above the average occurred a couple of weeks ago. Tuesday is on track to be the fifth of 11 days to close above the 20-day moving average. The ability to hold above the average is becoming increasingly important as gold attempts to build on its recent stabilization.

Silver Breakout Adds Fuel to the Bullish Case
Silver has been consolidating recently in a similar manner, and it began an upside breakout of its consolidation pattern on Tuesday. This provides additional support for a higher near-term bias in gold. A higher swing low of $3,959 was generated in gold three weeks ago and then an interim swing low of $3,996 last week, after completing a 78.6% Fibonacci retracement of the prior short advance. That low is now a key area of near-term support, and a drop below it would negate the following bullish scenario.
$4,166 Test Comes into View
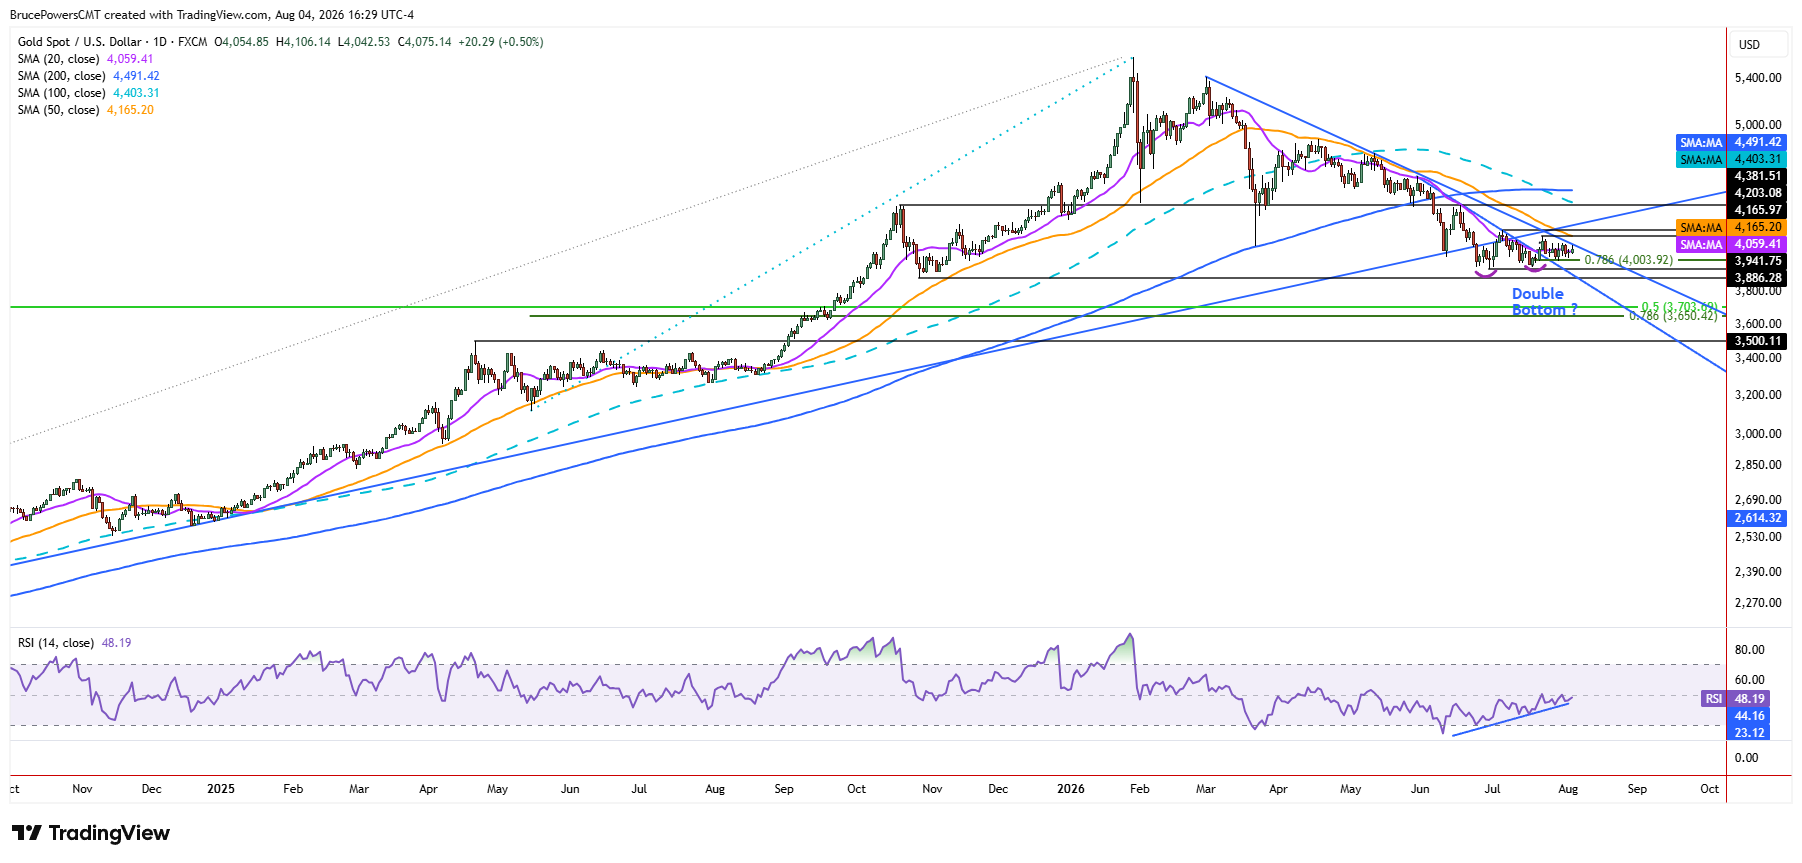
It is interesting to note that the 50-day moving average has now fallen to the next key price target at the recent lower swing high of $4,166. That adds to the significance of that resistance area and therefore to the importance of the price response there, which could show strong resistance or a decisive breakout above that key pivot zone. The falling 50-day moving average was recognized as resistance several times recently during short-term upswings. A decisive reclaim of the average would therefore be significant, while another rejection would reinforce its role as resistance. A breakout above it would likely signal that the downtrend is weakening and the developing advance is strengthening.
A Break Above $4,203 Changes the Picture
The more significant lower swing high is at $4,203, which is part of the bearish trend structure and therefore represents a key initial upside target. A rally above it will signal a reversal of the nearby downtrend and open the door to further strengthening. If this occurs, the first upside target is near the lower swing high of $4,382 and the 100-day moving average near $4,403 and falling. For now, the ability to hold above the 20-day moving average keeps that bullish scenario alive, with a move through $4,166 and then $4,203 providing progressively stronger confirmation.
If you’d like to know more about how to trade gold and silver, please visit our educational area.


