Gold News: Softer PPI Eases Fed Pressure as Central Banks Keep Buying
Gold and silver fundamentals on August 14 are due to softer U.S. inflation and ongoing geopolitical worries. July Producer prices were flat and core PPI increased by 0.2%, which shows that pipeline inflation is decelerating after the headline CPI increased by 0.1% only a few days prior. This caused markets to think that the Fed would raise rates much later, probably around September, and the odds of this happening dropped to about 35%. Some Fed officials believe inflation is still too high, but the rest think this puts less pressure on the Fed to raise rates.
Geopolitical worries are still a major factor and are holding up support. The US and Iran conflicts and worries about the Strait of Hormuz are causing worries about inflation and increasing worries about the stability of the financial system. The worries about inflation and the recent geopolitical worries are causing the demand for official sector buying. Reuters informs us that central banks bought 289 tonnes of gold in the second quarter worth about $45 billion. Almost half of all the reserve managers surveyed by the World Gold Council said they will increase buying gold in the next year.
The buying of gold will continue due to the increase of investment demand. Global gold ETFs showed an inflow of $3 billion in July and increased their holdings by 23 tonnes to 4,068 tonnes. This reversed two straight months of outflows.
Silver has a distinctive industrial story. The Silver Institute predicts a sixth consecutive market deficit in 2026. In contrast, physical investment is projected to increase by 20 percent to 227 million ounces. Industrial fabrication is anticipated to decline slightly to 650 million ounces, largely a result of solar manufacturers utilizing less silver. However, the structure supporting fabrication demand is expected to remain intact due to the anticipated increases in the demand for electronics, power infrastructure, and AI-related applications.
For August 14 the most important fundamental driving theme is that the slowing inflation in the United States is likely to decrease the headwind caused by an increasing interest rate environment. Central bank buying along with geopolitical risk should continue to support demand for precious metals.

Gold Technical Analysis: XAU/USD Holds Above $4,330 as Trendline Resistance Caps Upside
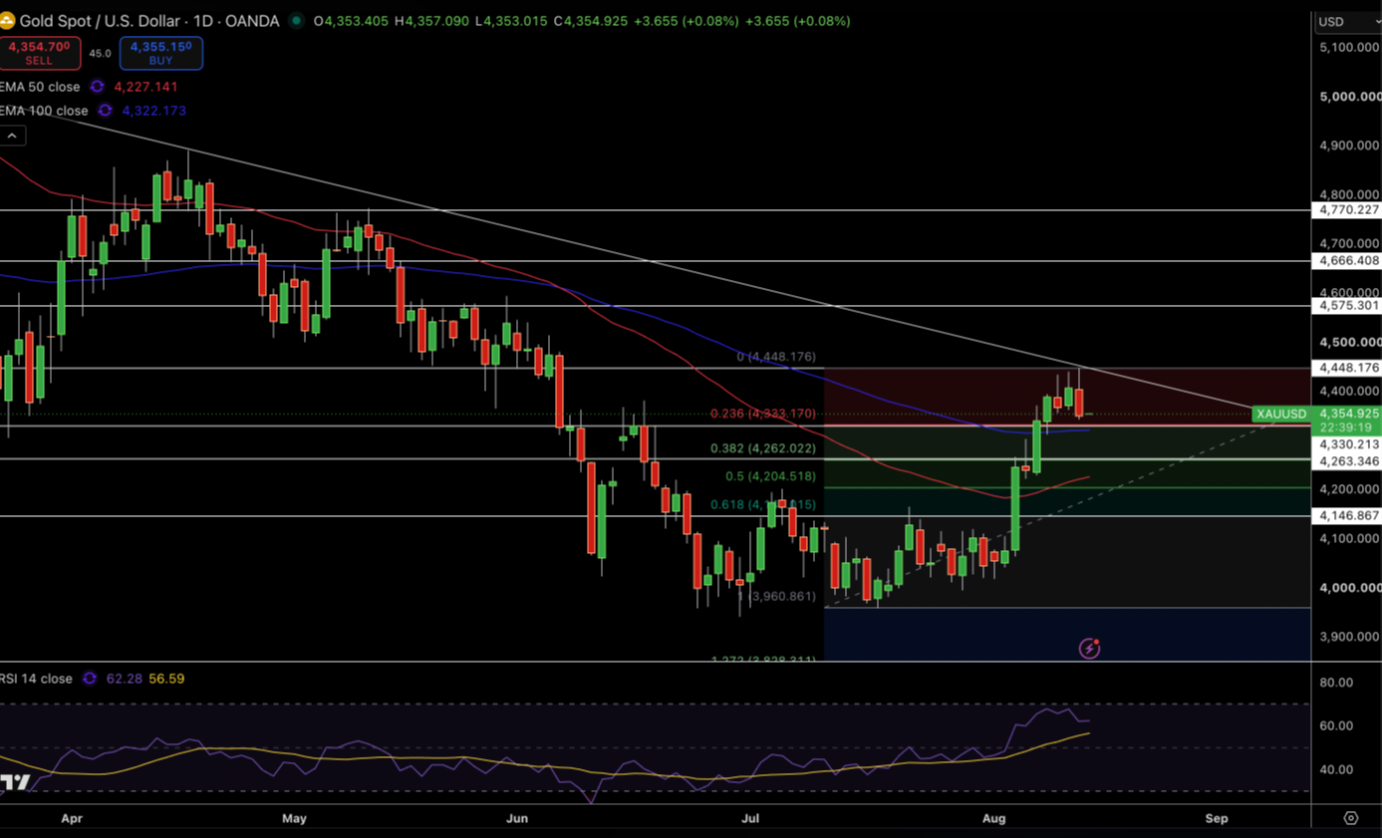
On the daily chart, gold is currently trading at around $4,355, rebounding strongly from the July lows. Currently, gold is hesitant to break above the descending trendline and the $4,448 resistance zone. For now, price is above the 50-day EMA at $4,227 and the 100-day EMA at $4,322 ,which supports the ongoing recovery even with the recent pause. The August rally was very strong and one should expect a little consolidation, as evidenced by the relatively small candle bodies.
The RSI is at around 62, which indicates positive momentum. There is resistance at the $4,448 zone, $4,575 , and $4,666. There is support at $4,448 zone, $4,330 – $4,322 and $4,263 $4,205.
In my opinion, as long as price is above $4,322 , the recovery is intact with the potential to move above $4,448 to $4,575. However, a price breakdown below $4,322 would take away the recovery potential and expose the other lower rally zones.
Gold Price Forecast
Every new Gold analysis as it publishes, today's technical signal and key levels, live price — on one page.
See all Gold forecastsSilver Technical Analysis: XAG/USD Tests $64.16 Support as Momentum Softens
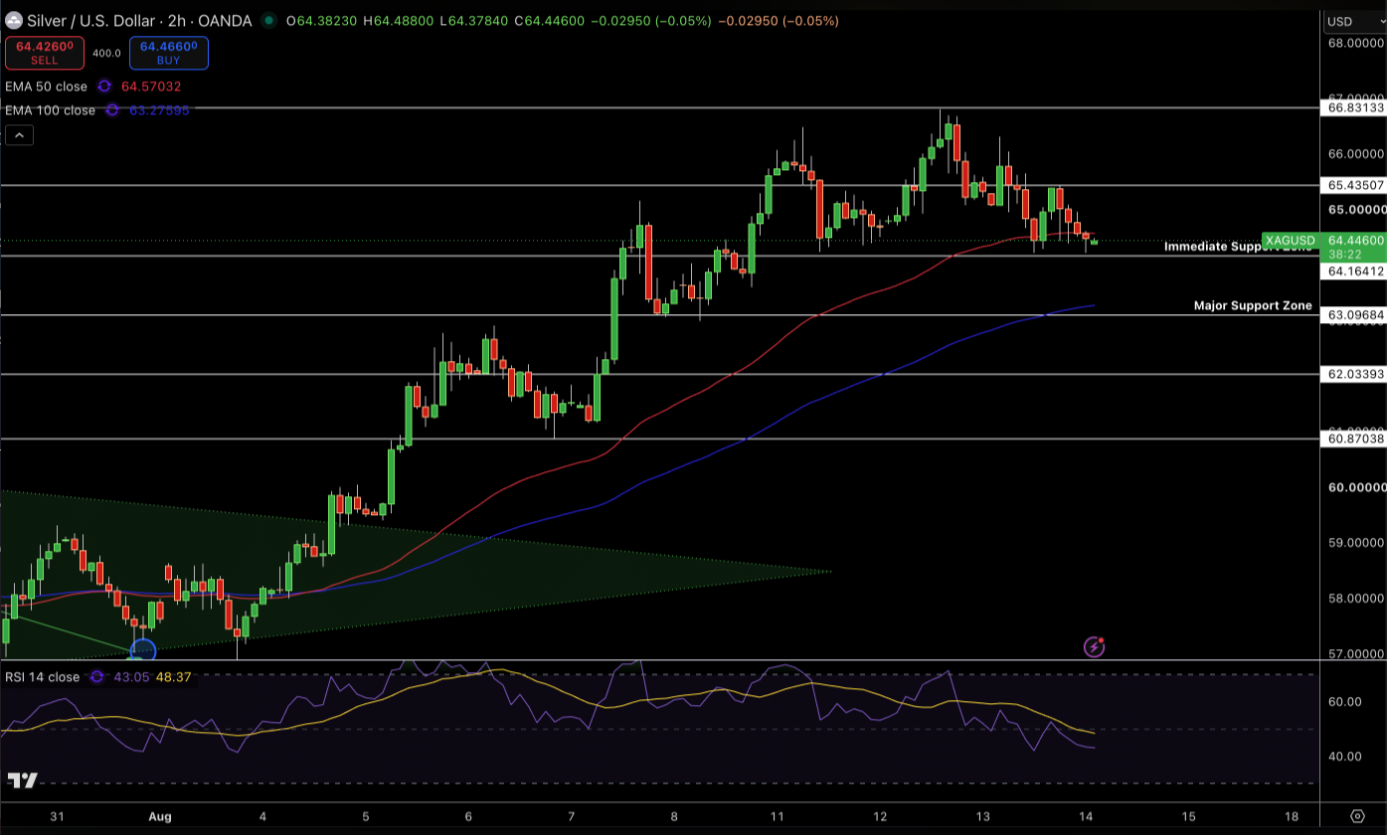
Silver is trading at $64.45 on the 2 hour chart and has pulled back from the $66.83 zone. Currently, silver is trading below the 50 EMA at $64.57 and is trading above the 100 EMA at $63.28. The recent candle formation suggests that momentum is slowly diminishing as evidenced by Silver trading at the $64.16 support.
RSI has settled around 43, indicating weaker short-term momentum and making the current support level more important. Resistance will begin around $65.44, followed by $66.83. First support will be around $64.16, with support at $63.10 and deeper support towards $62.04 and $60.87. I think that as long as $64.16 resistance holds, Silver will stabilize and attempt an upward movement towards $65.44, while support at $63.10 breaks and a move towards $62.04 and $60.87 will be possible.