



Geopolitical Tensions and Economic Signals Shape Oil Market Dynamics
Oil prices experienced a slight decline on Tuesday, despite nearing three-week highs amidst increasing tensions in the Middle East and signs of economic revival in China. The market’s subdued movement over the U.S. Presidents’ Day holiday and concerns over demand were influenced by geopolitical tensions and attacks on shipping by Iran-aligned Houthis.

Nonetheless, China’s economic measures and a surge in tourism revenue during the Lunar New Year holiday hinted at potential demand growth, although global shifts towards cleaner energy and an IEA report predicting reduced oil demand growth in 2024 dampened these bullish factors.
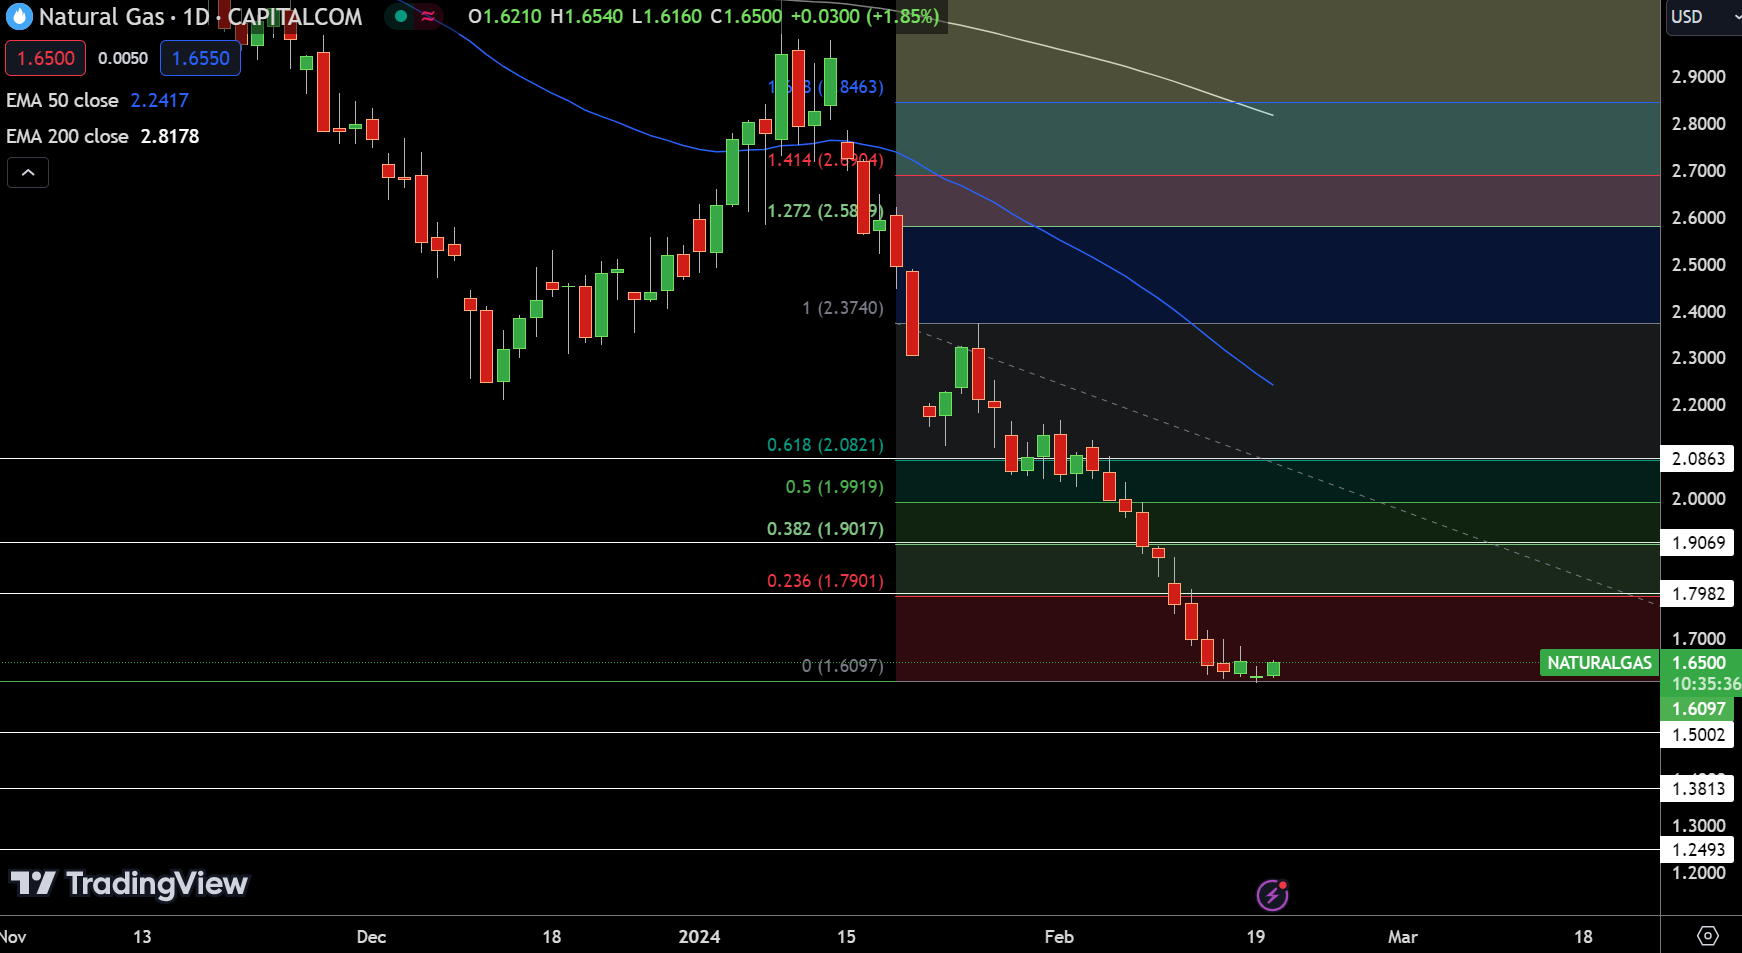
Natural Gas (NG) prices have ascended to $1.65, marking a 2.04% increase within the last 24 hours. This movement suggests a bullish sentiment above the pivot point of $1.6097. Key resistance levels are identified at $1.7982, $1.9069, and $2.0863, indicating potential upward momentum.
Conversely, immediate support levels are set at $1.5002, followed by $1.3813 and $1.2493, which could offer buying opportunities should the price retreat.
Despite the current uptick, NG prices remain well below the 50 and 200-day Exponential Moving Averages (EMAs) of $2.2417 and $2.8178, respectively, reflecting a longer-term bearish trend countered by recent bullish signals.
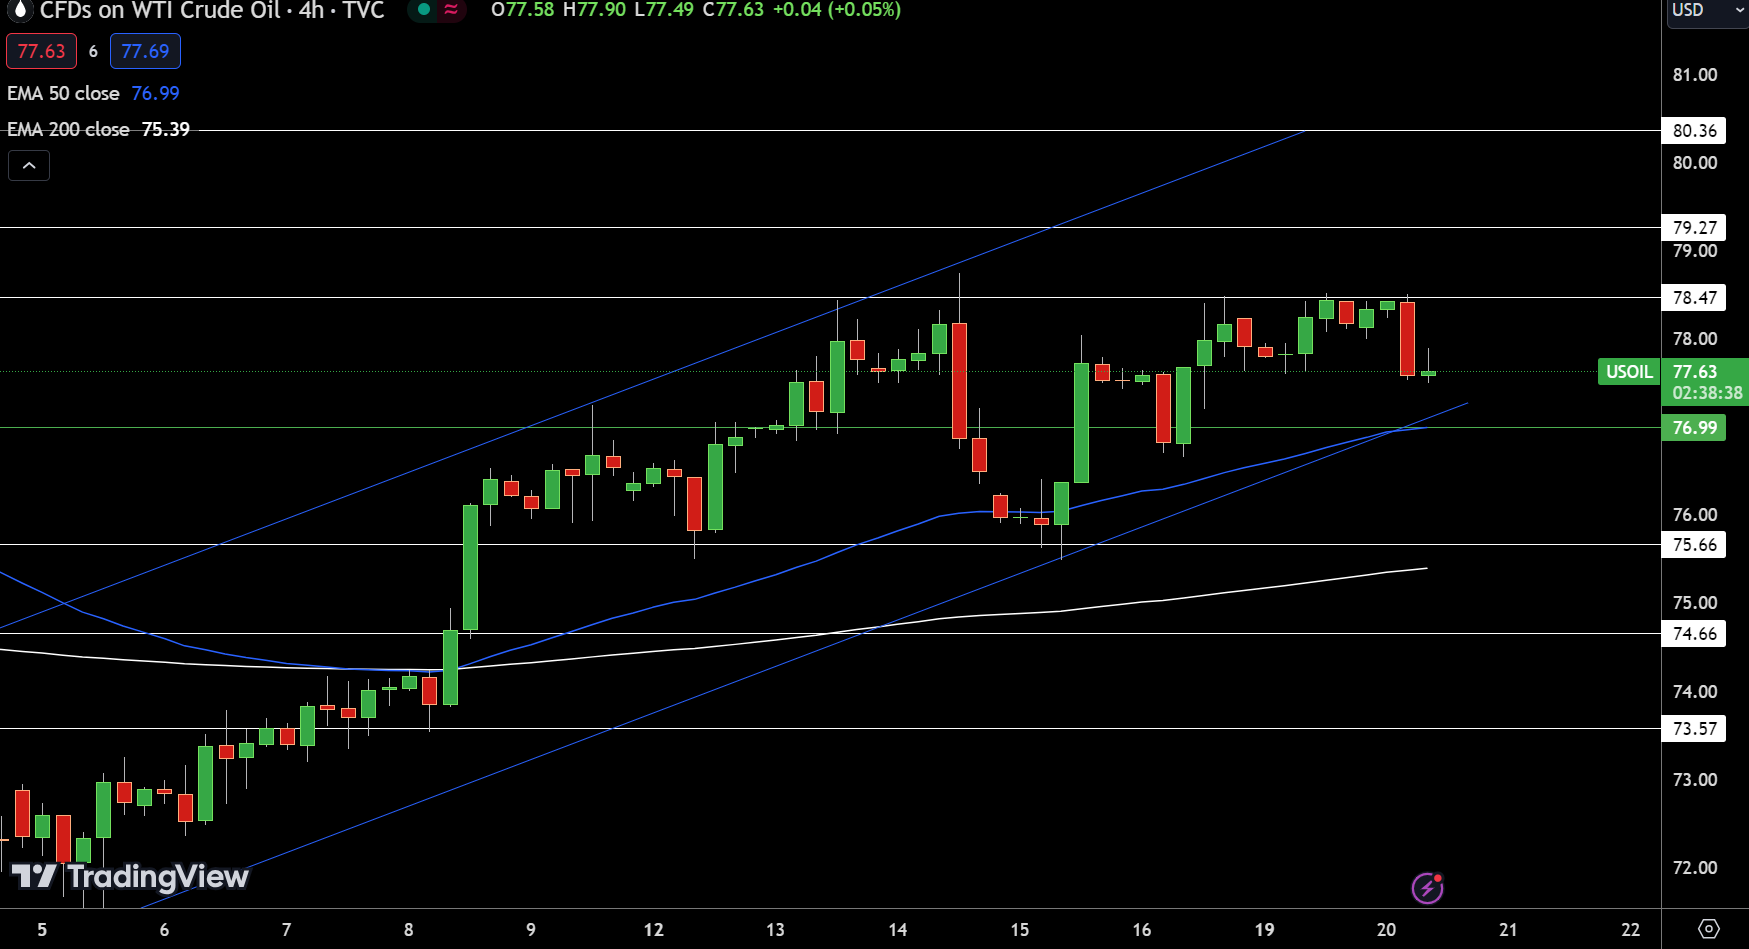
WTI Oil Price Forecast
Brent Oil Price Forecast
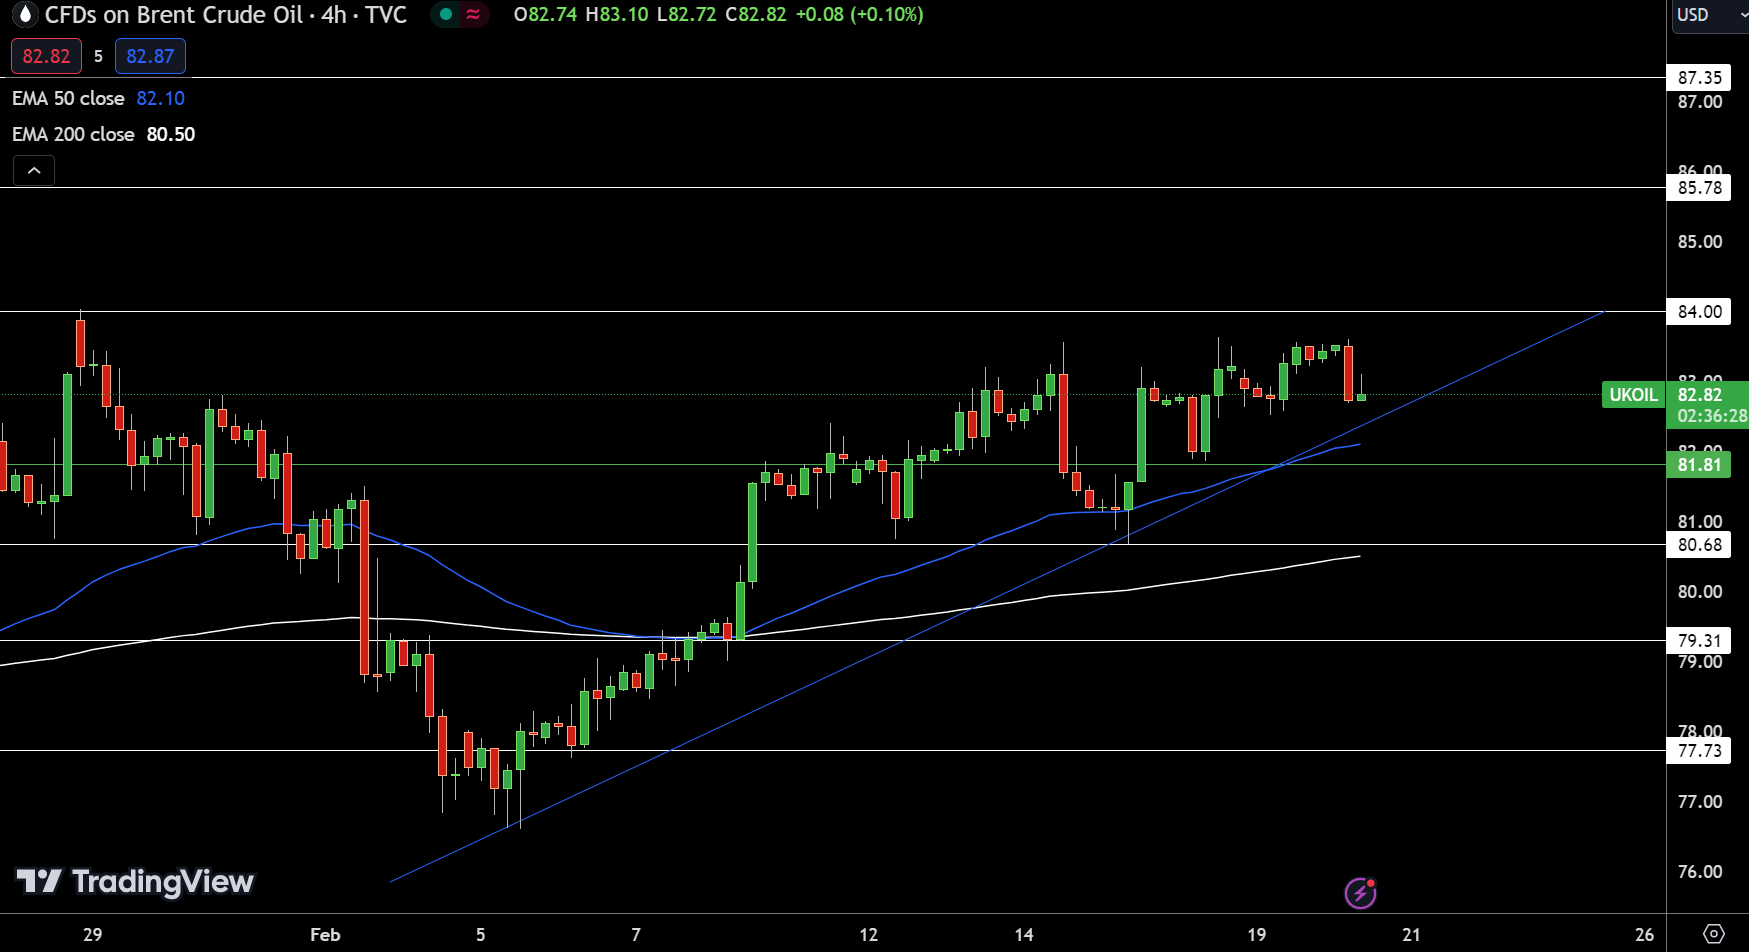
This alignment above key EMAs, coupled with the price’s stance relative to the pivot, indicates underlying strength and supports a cautiously optimistic view for UK Oil’s trajectory.
For a look at all of today’s economic events, check out our economic calendar.


