



Key Insights
- Oil prices face downward pressure from Saudi Arabia’s price reduction and a stronger US Dollar.
- Natural Gas shows a slight decline, trading at $2.522, with an upward trend in the charts.
- WTI and Brent Oil navigate key technical levels, hinting at potential market shifts.
- Market closely monitors US jobless claims data and its impact on Oil prices.
- Investors analyze economic data for insights into Natural Gas and Oil price trends.
Quick Fundamental Outlook

Natural Gas Price Forecast
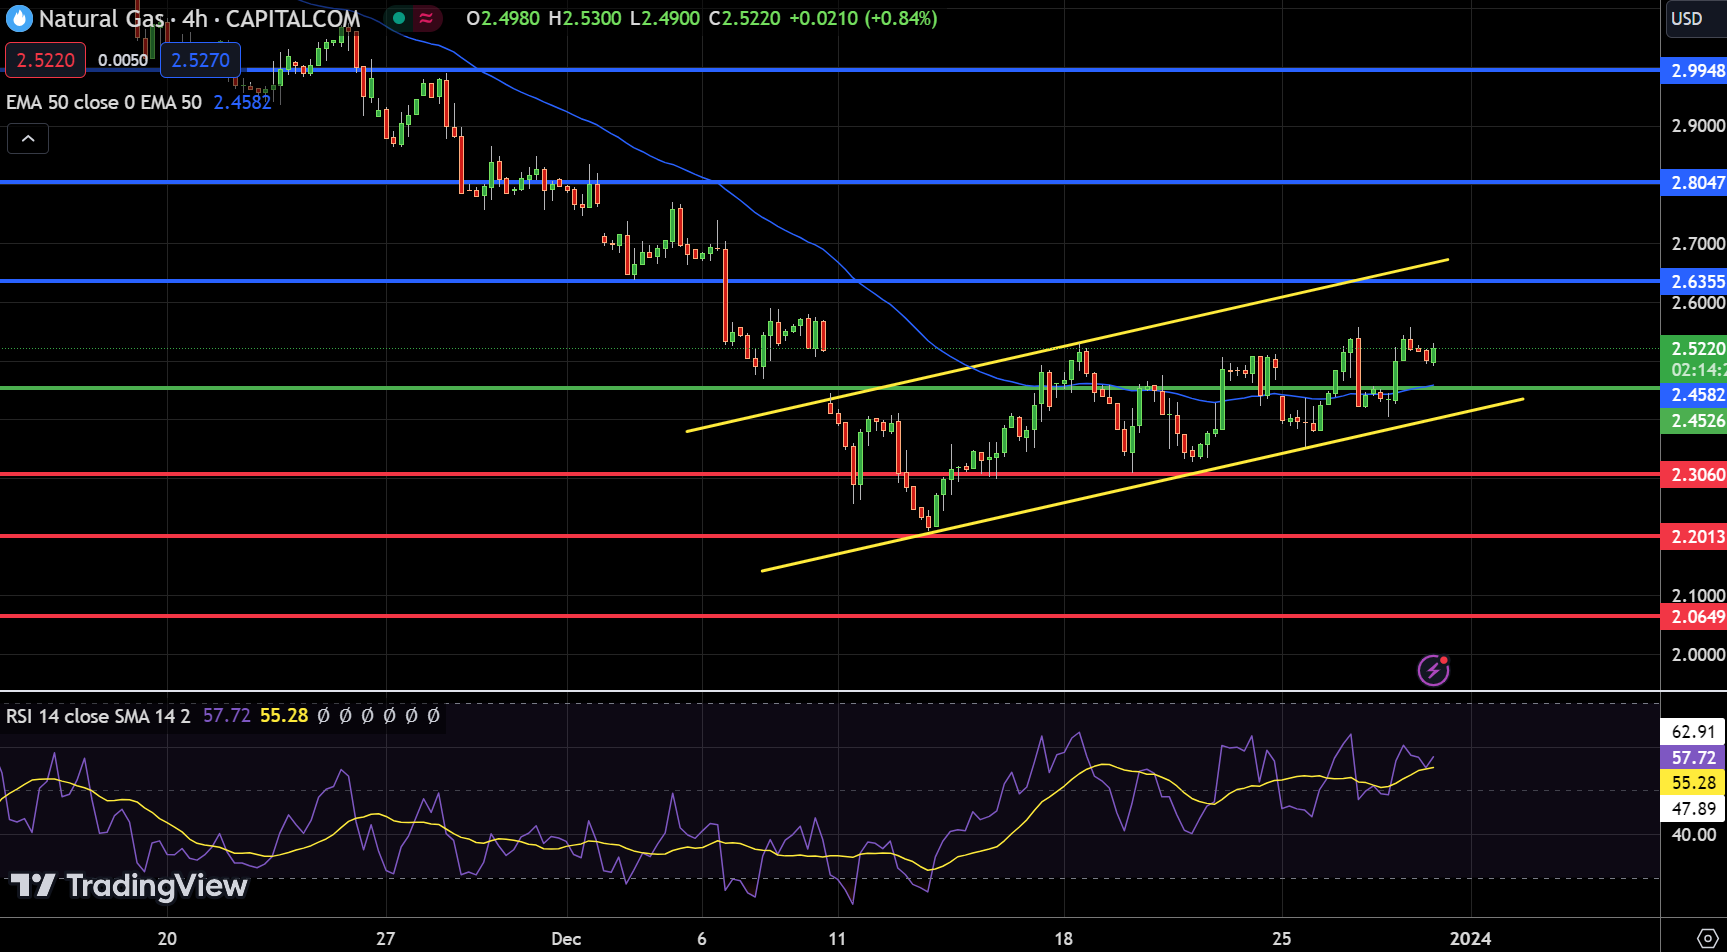
Natural Gas (NG) is currently showing a modest decline, trading at $2.522, down by 0.36%. This movement in NG prices is being analyzed within a comprehensive framework of key technical levels and indicators. The pivot point for NG is set at $2.45, which is crucial for determining its short-term market direction.
The immediate resistance levels for NG are situated at $2.64, $2.80, and $2.99, marking the potential upper barriers for price movements. Conversely, support levels are established at $2.31, $2.20, and $2.06, offering key thresholds against any potential decline in prices.
Technically, the Relative Strength Index (RSI) for NG stands at 57, indicating a slightly bullish sentiment, but not strong enough to suggest overbought conditions.
The Moving Average Convergence Divergence (MACD) shows a value of 0.0049, which, although below its signal line at 0.0208, does not significantly undermine the positive outlook. Furthermore, NG is trading just above its 50-Day Exponential Moving Average (EMA) of $2.46, reinforcing a short-term bullish trend.
The presence of an upward channel in the chart pattern suggests that NG is likely to continue its current trajectory, barring any significant market developments.
WTI Oil Price Forecast
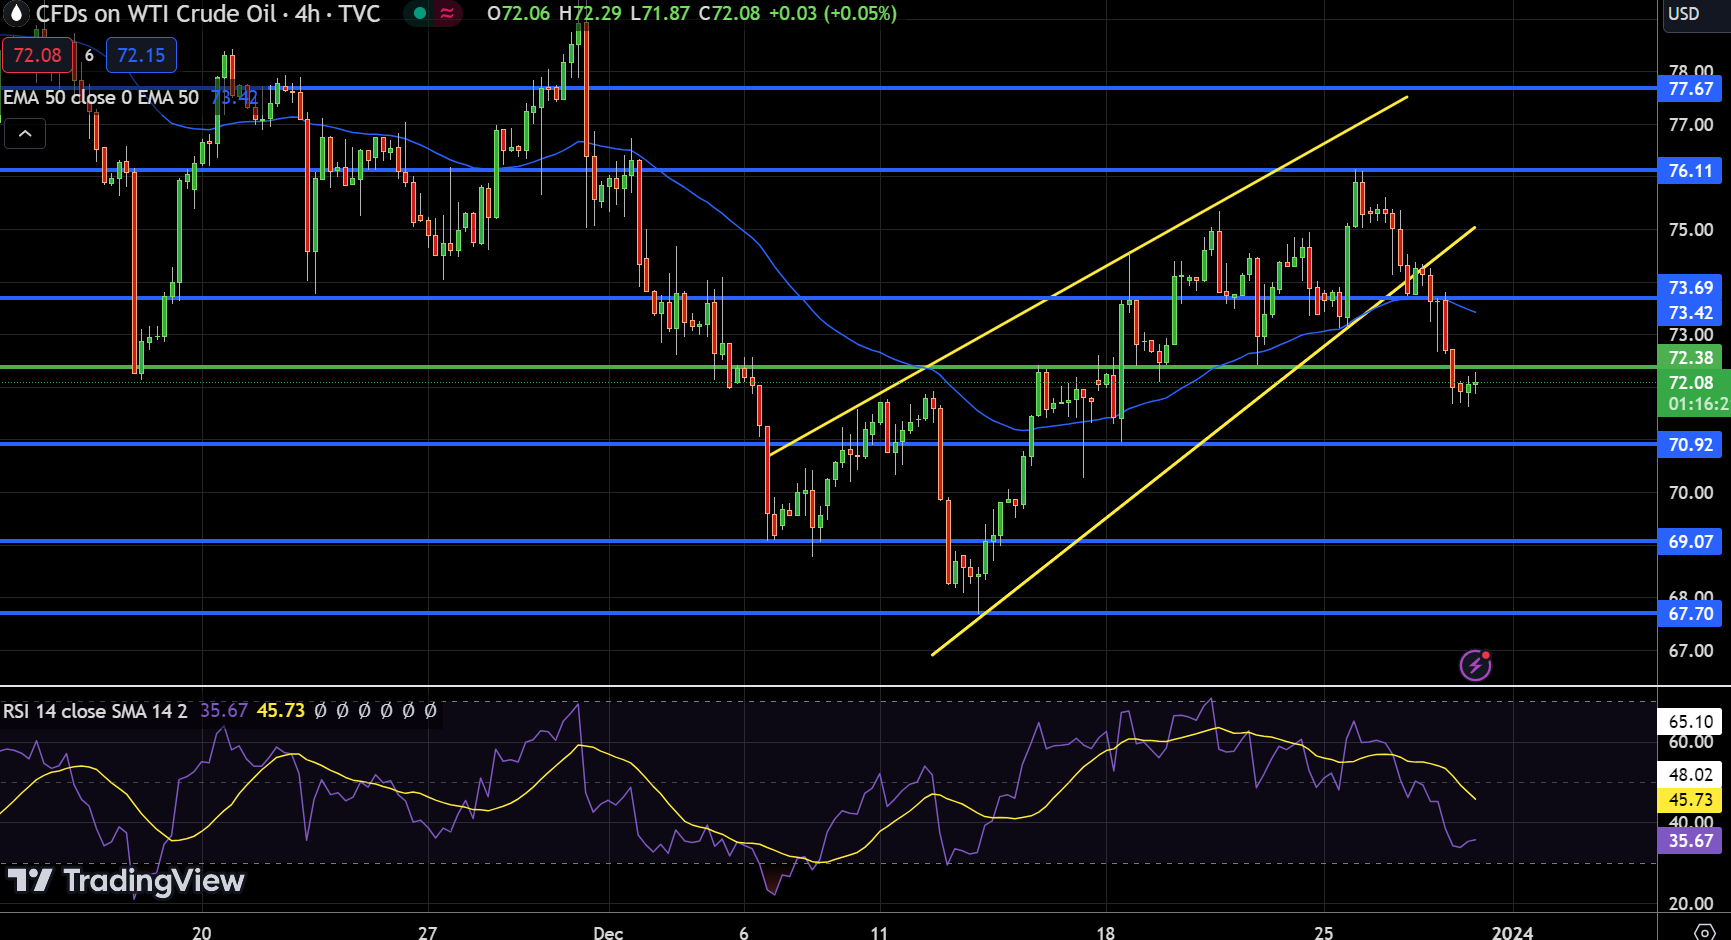
USOIL, also known as West Texas Intermediate (WTI) crude oil, is exhibiting a slight downtrend, currently priced at $72.08, reflecting a marginal decrease of 0.05%. The oil market is currently navigating through significant technical levels, with the pivot point established at $72.38.
The immediate resistances are set at $73.69, $76.11, and $77.67, signifying potential upper limits for price movements. Conversely, support levels are found at $70.92, $69.07, and $67.70, offering crucial thresholds against downward price action.
The Relative Strength Index (RSI) for USOIL is at 35, indicating a bearish sentiment but not entering oversold territory. The Moving Average Convergence Divergence (MACD) stands at -0.31, marginally better than its signal line at -0.53, hinting at a possibility of upward movement. Importantly, USOIL is currently trading below its 50-Day Exponential Moving Average (EMA) of $73.42, suggesting a short-term bearish trend.
In summary, the technical outlook for USOIL seems cautiously optimistic above the $72 mark. This stance is reinforced by the recent breach of the upward channel and the formation of a Doji candlestick pattern, indicating potential for a reversal and a subsequent buying trend.
Brent Oil Price Forecast
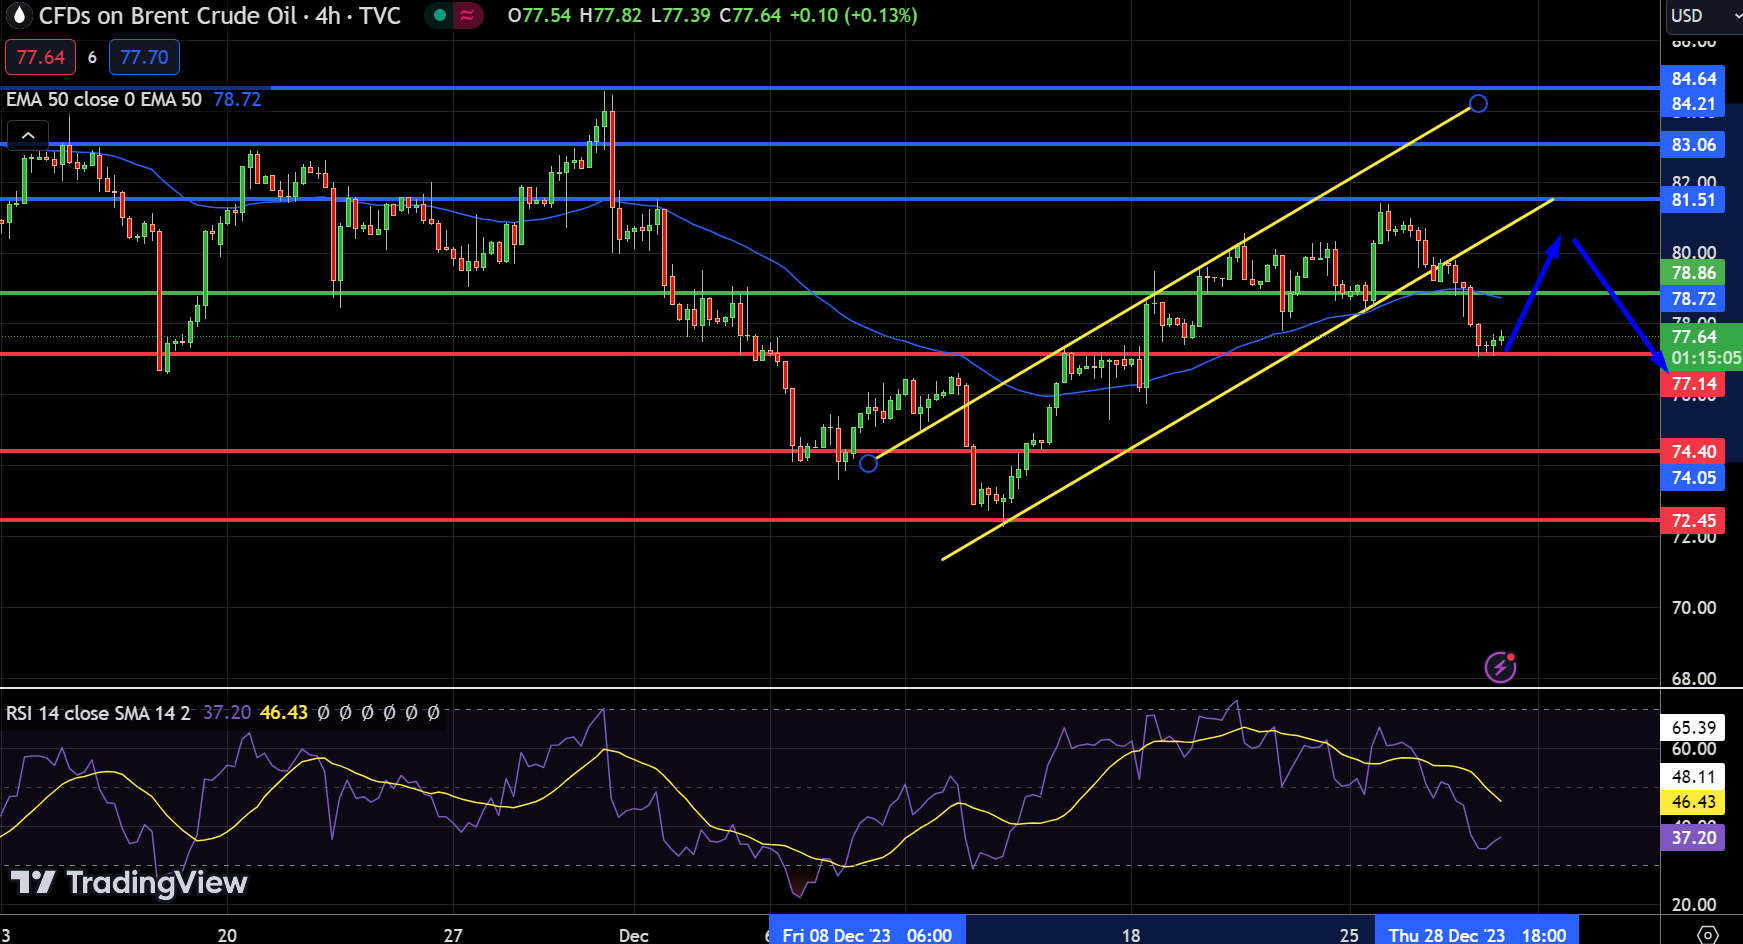
UKOIL, commonly known as Brent crude oil, has shown a slight increase in its trading value, currently at $77.64, marking a 0.12% rise. The oil market is closely observing key technical levels, with the pivot point set at $78.86.
Resistance levels are identified at $81.51, $83.06, and $84.64, indicating potential upward movement limits. Conversely, support levels are at $77.14, $74.40, and $72.45, offering a cushion for any downward trends.
The Relative Strength Index (RSI) for UKOIL is at 37, suggesting a bearish sentiment but not in oversold territory. The Moving Average Convergence Divergence (MACD) at -0.3000, slightly above its signal line at -0.4700, hints at potential upward momentum. Notably, UKOIL is trading just below its 50-Day Exponential Moving Average (EMA) of $74.05, indicating a short-term bearish trend.
In summary, the current market trend for UKOIL appears cautiously bullish above the $77.65 level, as indicated by the recent breach of the upward channel and the formation of a Doji candlestick pattern.
For a look at all of today’s economic events, check out our economic calendar.


