



Key Insights
Oil Prices Edge Up Amid OPEC+ Policy Hold and Fed Rate Signals
The Federal Reserve’s stance to keep interest rates steady, coupled with Chair Jerome Powell’s indication of future rate decreases, has also supported oil prices by potentially enhancing economic growth and oil demand.
Nonetheless, oil is on track for a 5% weekly decline, influenced by geopolitical tensions and doubts about China’s economic resurgence, forecasting a slowdown to 4.6% in 2024.
Natural Gas Price Forecast
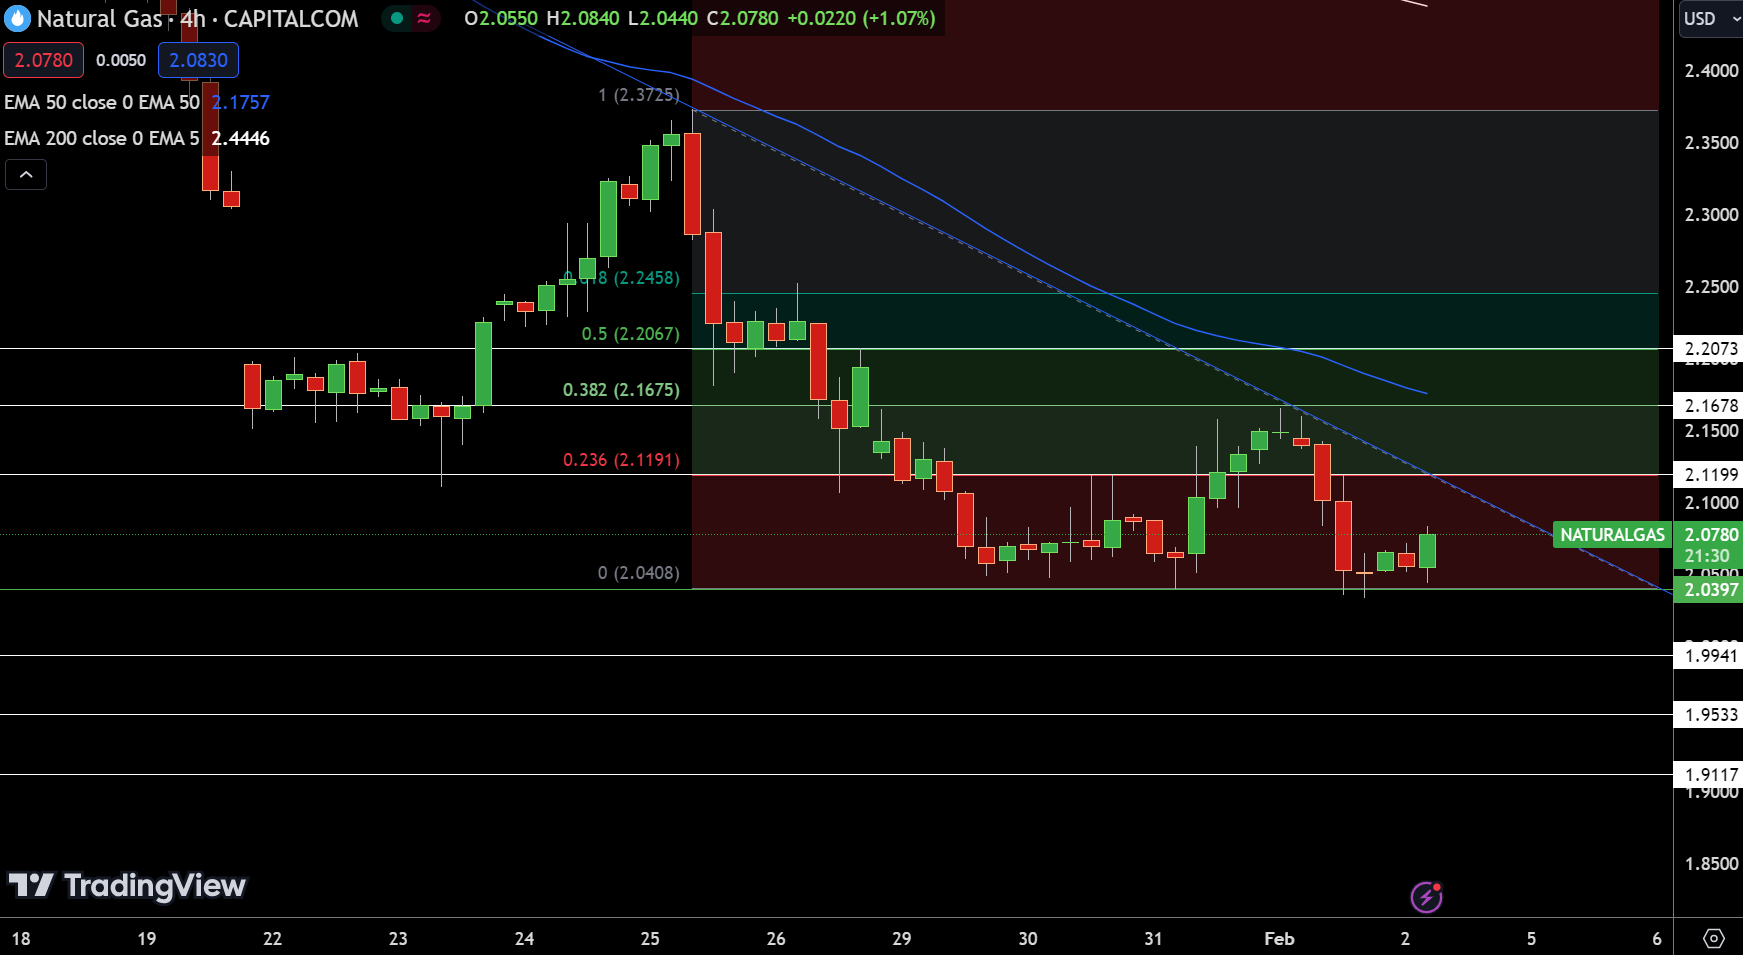
Natural Gas (NG) prices ascended by 0.88%, reaching $2.0780. The 4-hour chart establishes a pivot at $2.0397, suggesting an inflection point for future price movements. Resistance is mapped out at Fibonacci retracement levels: $2.1199 (23.6%), $2.1678 (38.2%), and $2.2073 (50%), delineating potential upward targets.
Support, conversely, is poised at $1.9941, with further floors at $1.9533 and $1.9117, indicating possible pullback zones. Technical indicators show a 50-day EMA at $2.1757 and a 200-day EMA at $2.4446, reflecting the overarching bearish pressure.
A notable triple bottom pattern around the pivot point suggests a crucial juncture; breaching below could trigger further declines towards $1.9941, whereas maintaining above might pave the way for retracement gains.
The outlook for Natural Gas remains cautiously optimistic above the $2.0397 threshold, with the market’s direction hinging on its ability to sustain above this critical support level.
WTI Oil Price Forecast
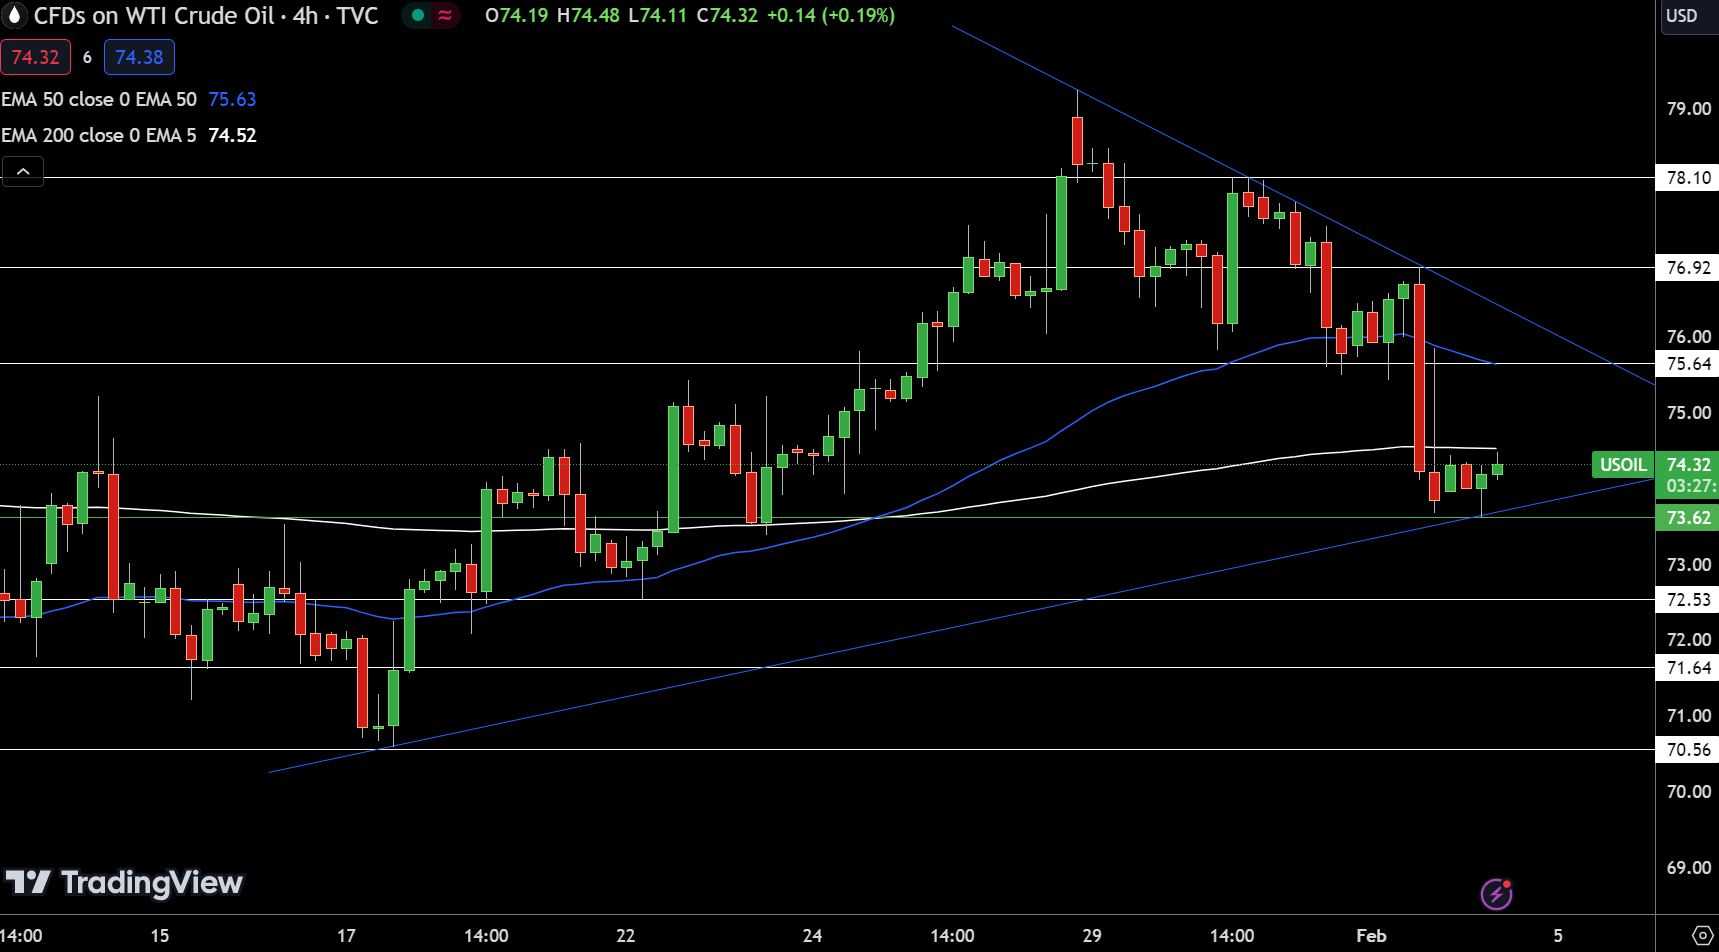
U.S. Crude Oil has marked a slight increase of 0.40% in today’s trading, bringing its price to $74.14. The 4-hour chart reveals a pivot point at $73.62, indicating a foundational level for potential price movements. Resistance levels are poised at $75.64, $76.92, and $78.10, delineating potential challenges for upward momentum.
Conversely, support stands firm at $72.53, with subsequent levels at $71.64 and $70.56, suggesting floors for any retracements. Technical analysis highlights a 50-day Exponential Moving Average (EMA) at $75.63 and a 200-day EMA at $74.52, closely mirroring current pricing and suggesting a tight trading range.
A notable double bottom pattern at the pivot point of $73.62, coupled with the formation of neutral candles above this level, hints at the possibility of a bullish correction.
Brent Oil Price Forecast
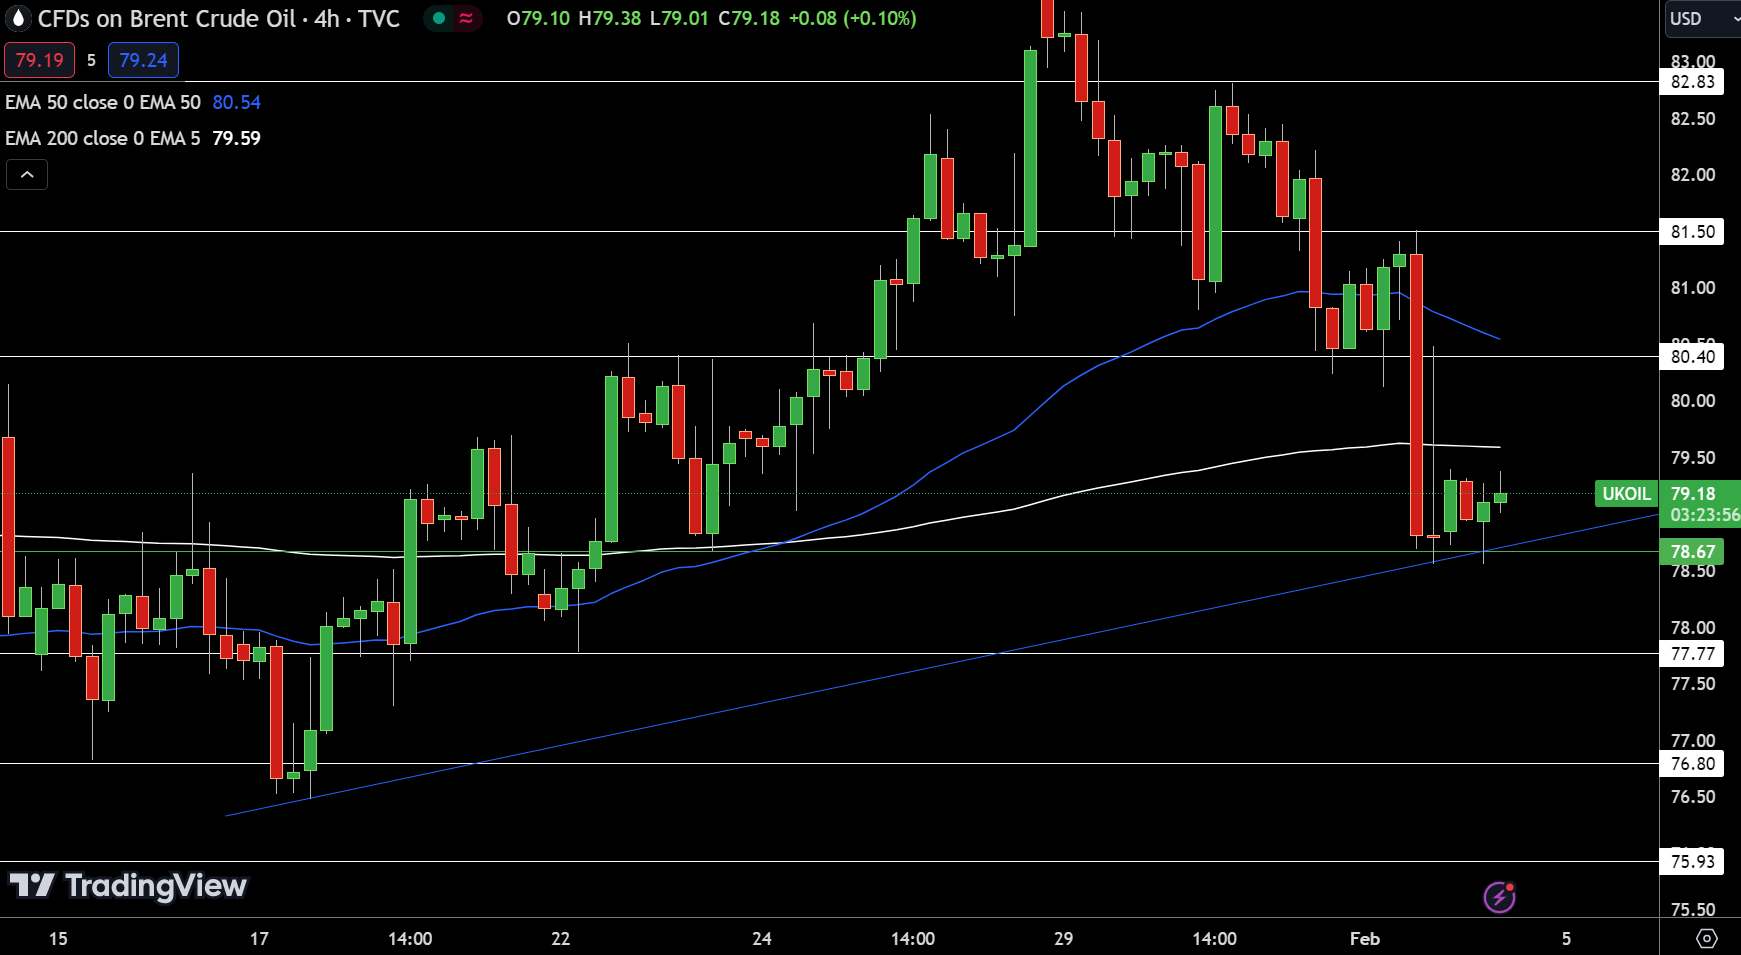
UK Oil (Brent Oil) sees a modest uptick of 0.27%, positioning at $79.00. The 4-hour chart delineates a pivot at $78.67, hinting at initial bullish momentum. Resistance is identified at $80.40, $81.50, and $82.83, indicating potential hurdles for further ascents. Support levels are established at $77.77, $76.80, and $75.93, providing a cushion against declines.


