



Key Insights
- Oil prices stagnate despite API’s report of a 5.2 million barrel drop and EIA’s 2024 supply shortfall forecast.
- Natural Gas experiences a 2.71% decline, trading close to the pivotal $2.87 point.
- US and UK Oil witness slight gains amid anticipation of CPI data’s influence on the market.
Quick Fundamental Outlook
Lower oil prices in the latter half of last year may contribute to reduced US inflation. The EIA weekly report anticipates another oil stock drawdown, impacting USOIL, UKOIL, and Natural Gas.
Natural Gas Price Forecast
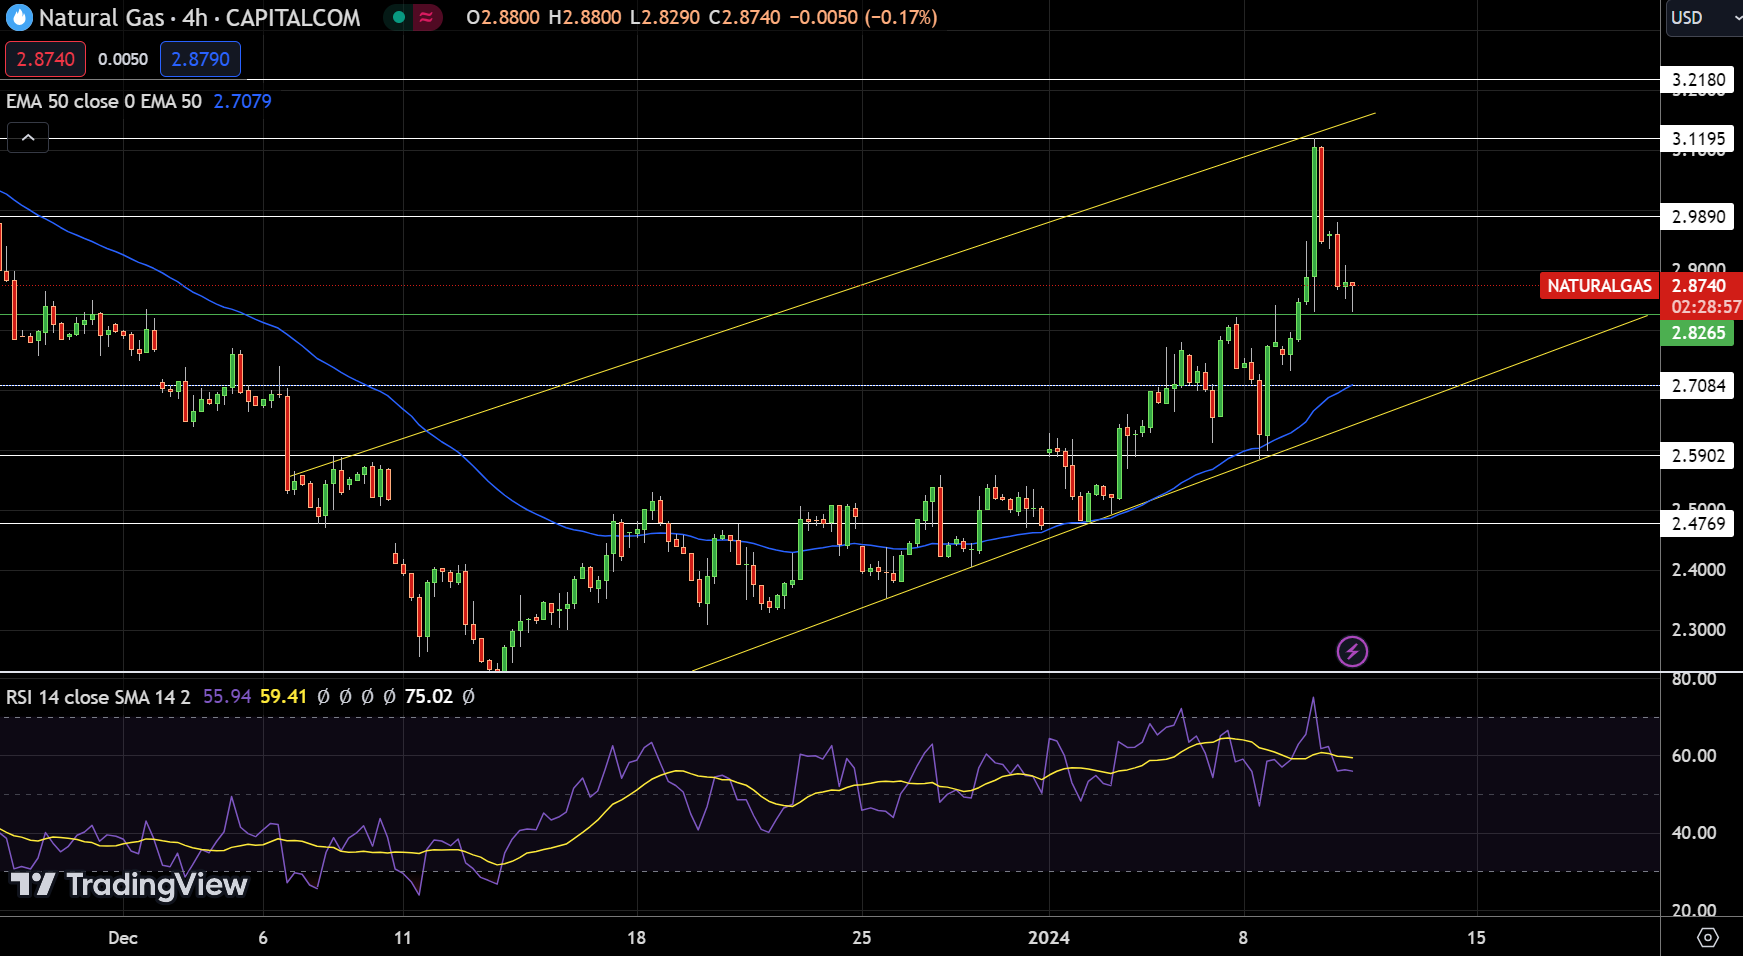
On January 10, Natural Gas (NG) experienced a significant drop of 2.71%, trading at $2.86. This price situates NG just beneath its pivot point (green line) of $2.87, a critical juncture for its immediate market trajectory.
Looking forward, NG faces resistance at $2.99, with subsequent hurdles at $3.12 and $3.22. These points are key for NG to rebound from its current level. Conversely, support for NG is found at $2.71, with additional levels at $2.59 and $2.48, potentially preventing further drops.
The Relative Strength Index (RSI) is at 55, indicating a market that is neither distinctly bullish nor bearish. Notably, NG’s 50-Day Exponential Moving Average (EMA) aligns with its immediate support level at $2.71. The chart analysis shows a Doji candlestick pattern near the $2.87 pivot point, reflecting market indecision.
WTI Oil Price Forecast
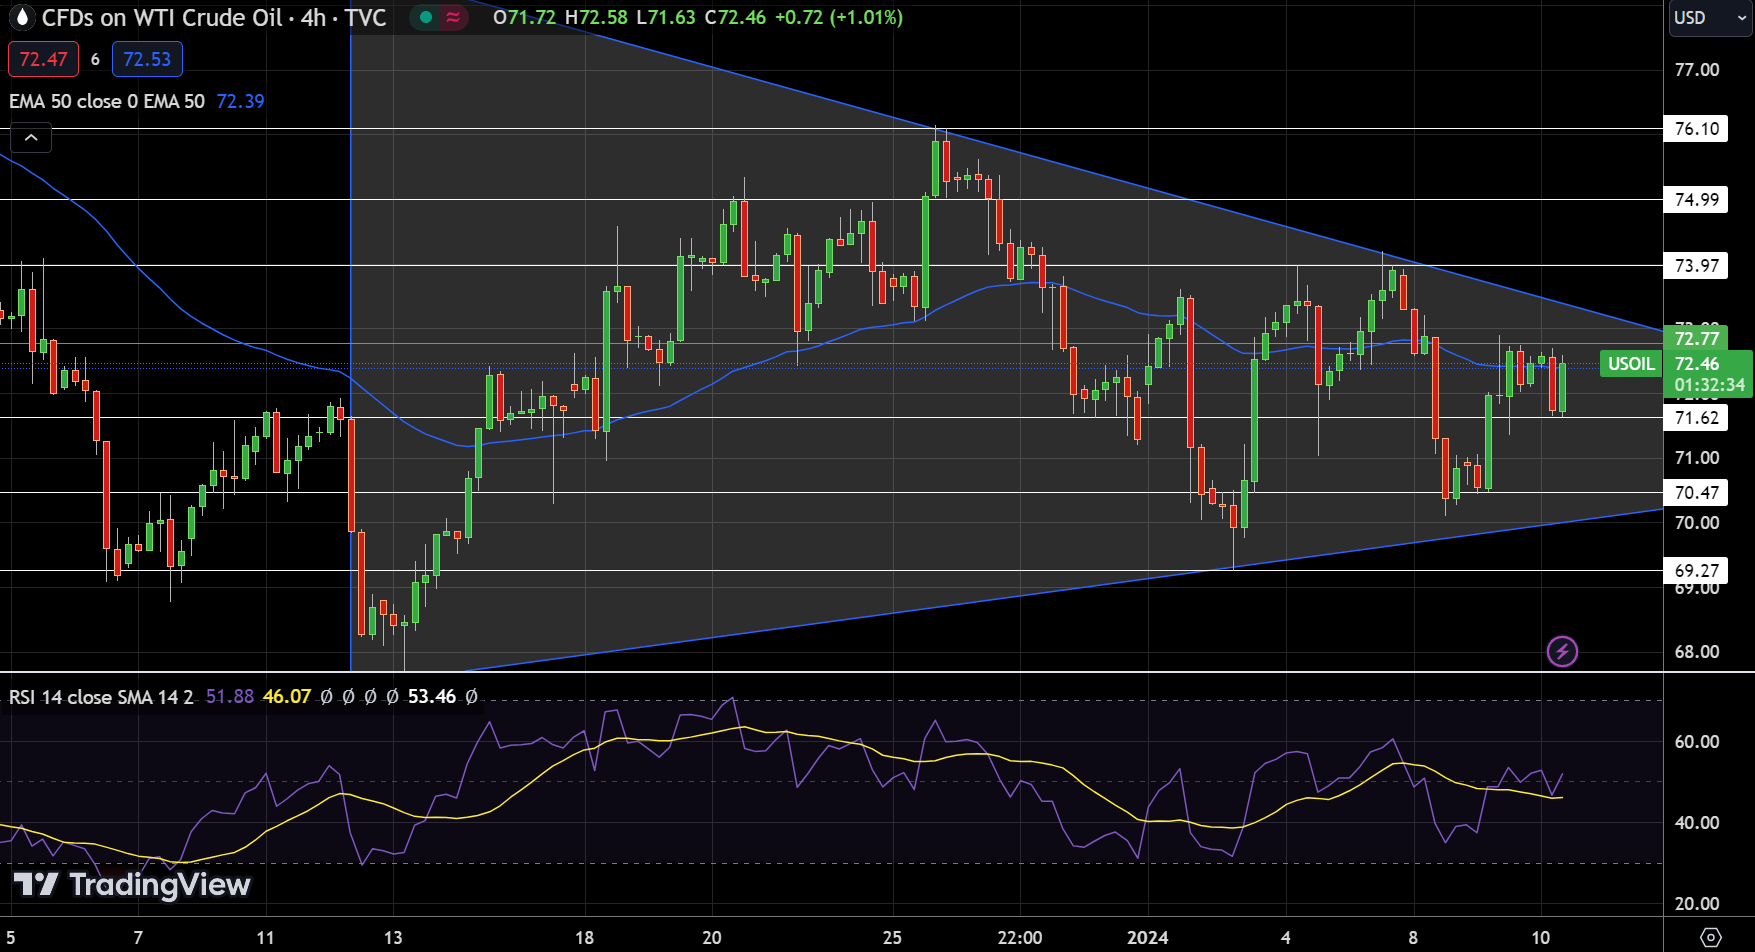
On January 10, US Oil (WTI) is trading at $72.53, up by 0.53%. This movement places US Oil slightly below its pivot point of $72.77, a critical juncture for potential price direction. Looking ahead, the commodity faces resistance at $73.97, followed by higher barriers at $74.99 and $76.10.
Conversely, support levels are identified at $71.62, $70.47, and $69.27, which could provide stability in the event of a price pullback.
The Relative Strength Index (RSI) is at a neutral 51, indicating neither overbought nor oversold conditions, suggesting a balanced market sentiment. Additionally, US Oil is trading just above its 50-Day Exponential Moving Average (EMA) of $72.40, hinting at a slight bullish bias in the short term.
Formation of a symmetrical triangle is suggesting a consolidation phase within a range of $70.45 to $74. This pattern indicates indecision among traders, with a breakout in either direction likely to set the tone for future price action.
Brent Oil Price Forecast
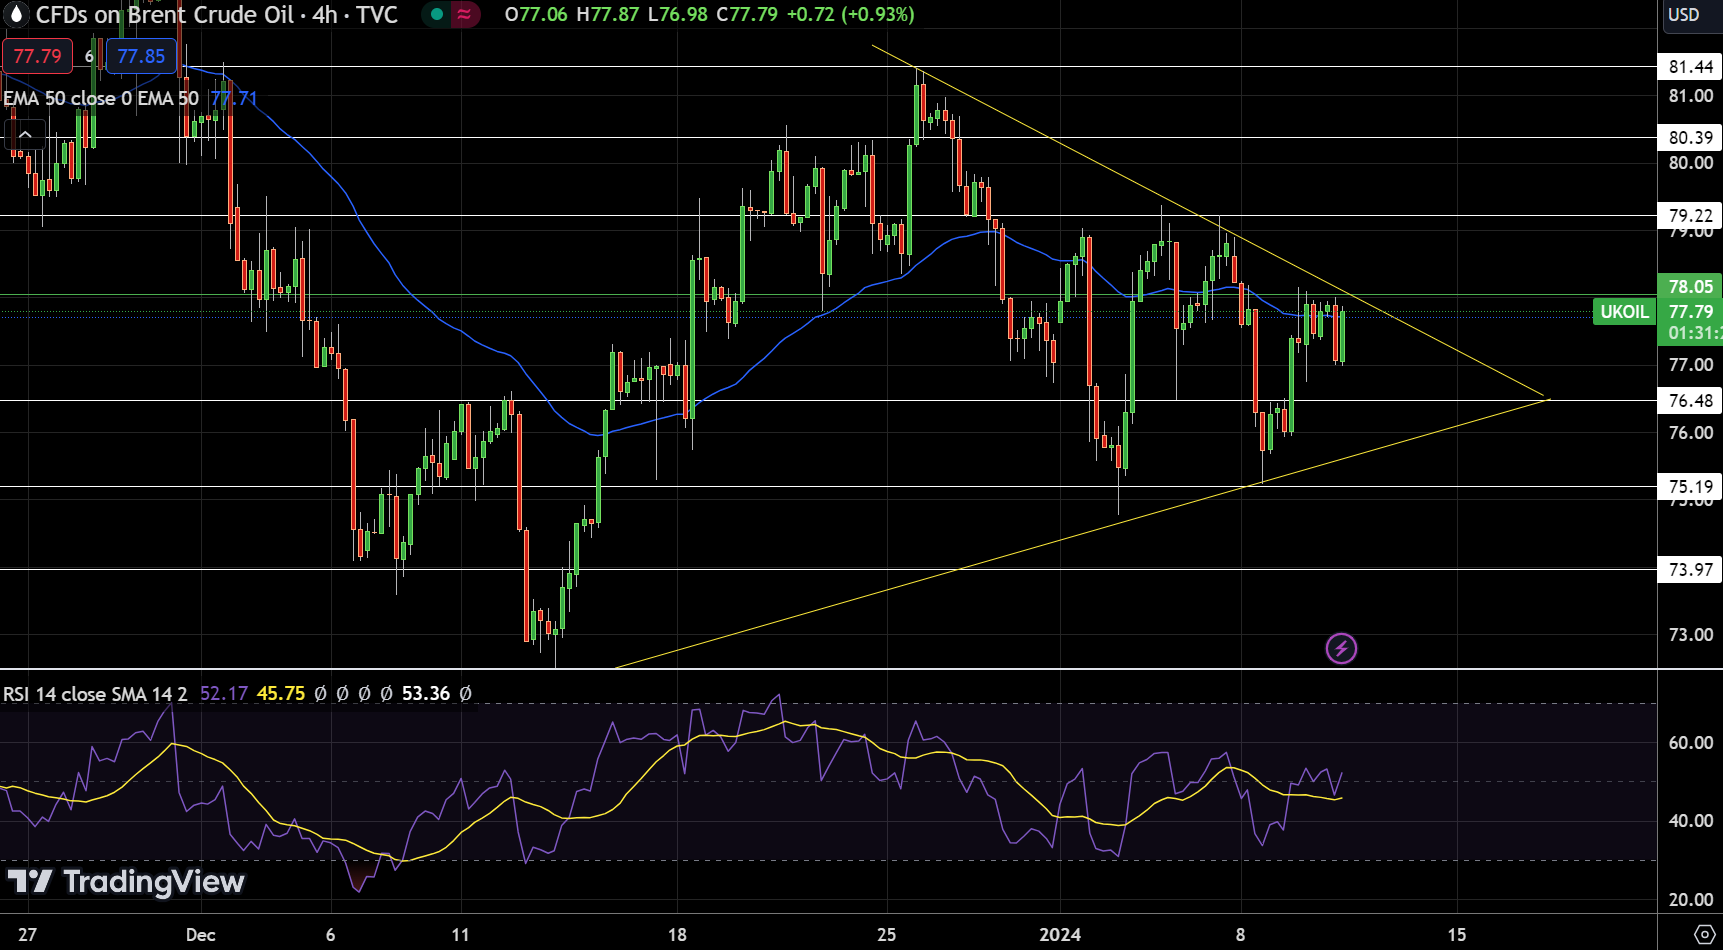
On January 10, UK Oil (Brent) edged up slightly, trading at $77.85, marking a 0.50% increase. Currently, it’s positioned just below the pivot point (green line) of $78.05. Brent faces resistance at $79.22, $80.39, and $81.44, which are key to gauging its potential for further gains. Support levels are established at $76.48, $75.19, and $73.97, offering buffers against declines.
The Relative Strength Index (RSI) is moderately bullish at 52. Additionally, Brent is trading above its 50-Day Exponential Moving Average (EMA) at $77.71, suggesting a slight bullish bias.


