Key Insights
- WTI crude trading near $70, affected by US economic slowdown and Fed rate cut expectations.
- Oil prices struggle despite Red Sea naval tensions and global economic concerns.
- Upcoming US EIA and API data crucial for oil market movements.
- NG exhibiting a downtrend, with pivotal support at $2.48.
Quick Fundamental Outlook
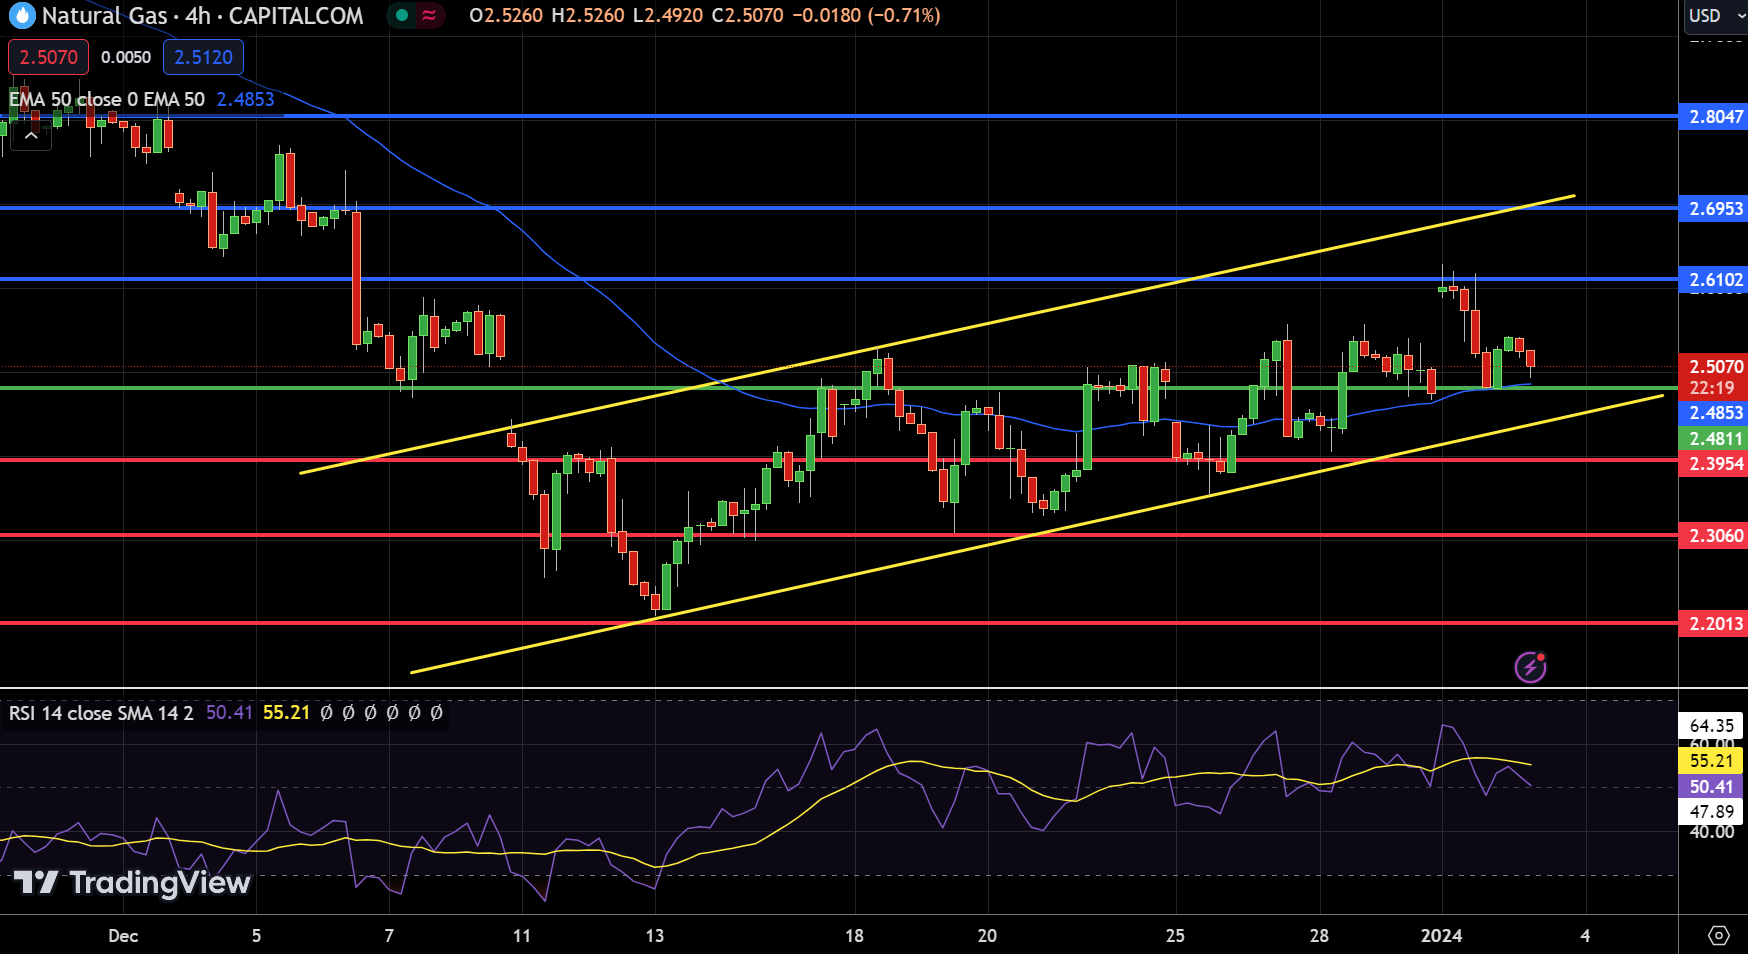
Natural Gas (NG) is currently exhibiting a downward trend, with a 0.71% decrease to $2.5070. The pivotal point for NG is established at $2.48, with immediate resistances at $2.61, $2.70, and $2.80. Support levels are at $2.40, $2.31, and $2.20.
The Relative Strength Index (RSI) is neutral at 50, indicating neither overbought nor oversold conditions. The Moving Average Convergence Divergence (MACD) at -0.004, with a signal line at 0.017, suggests a mixed outlook.

The 50-Day Exponential Moving Average (EMA) at $2.49 appears to be providing support for Natural Gas around $2.45. The current technical outlook for NG is cautiously optimistic, with a bullish trend above the $2.45 mark.
WTI Oil Price Forecast
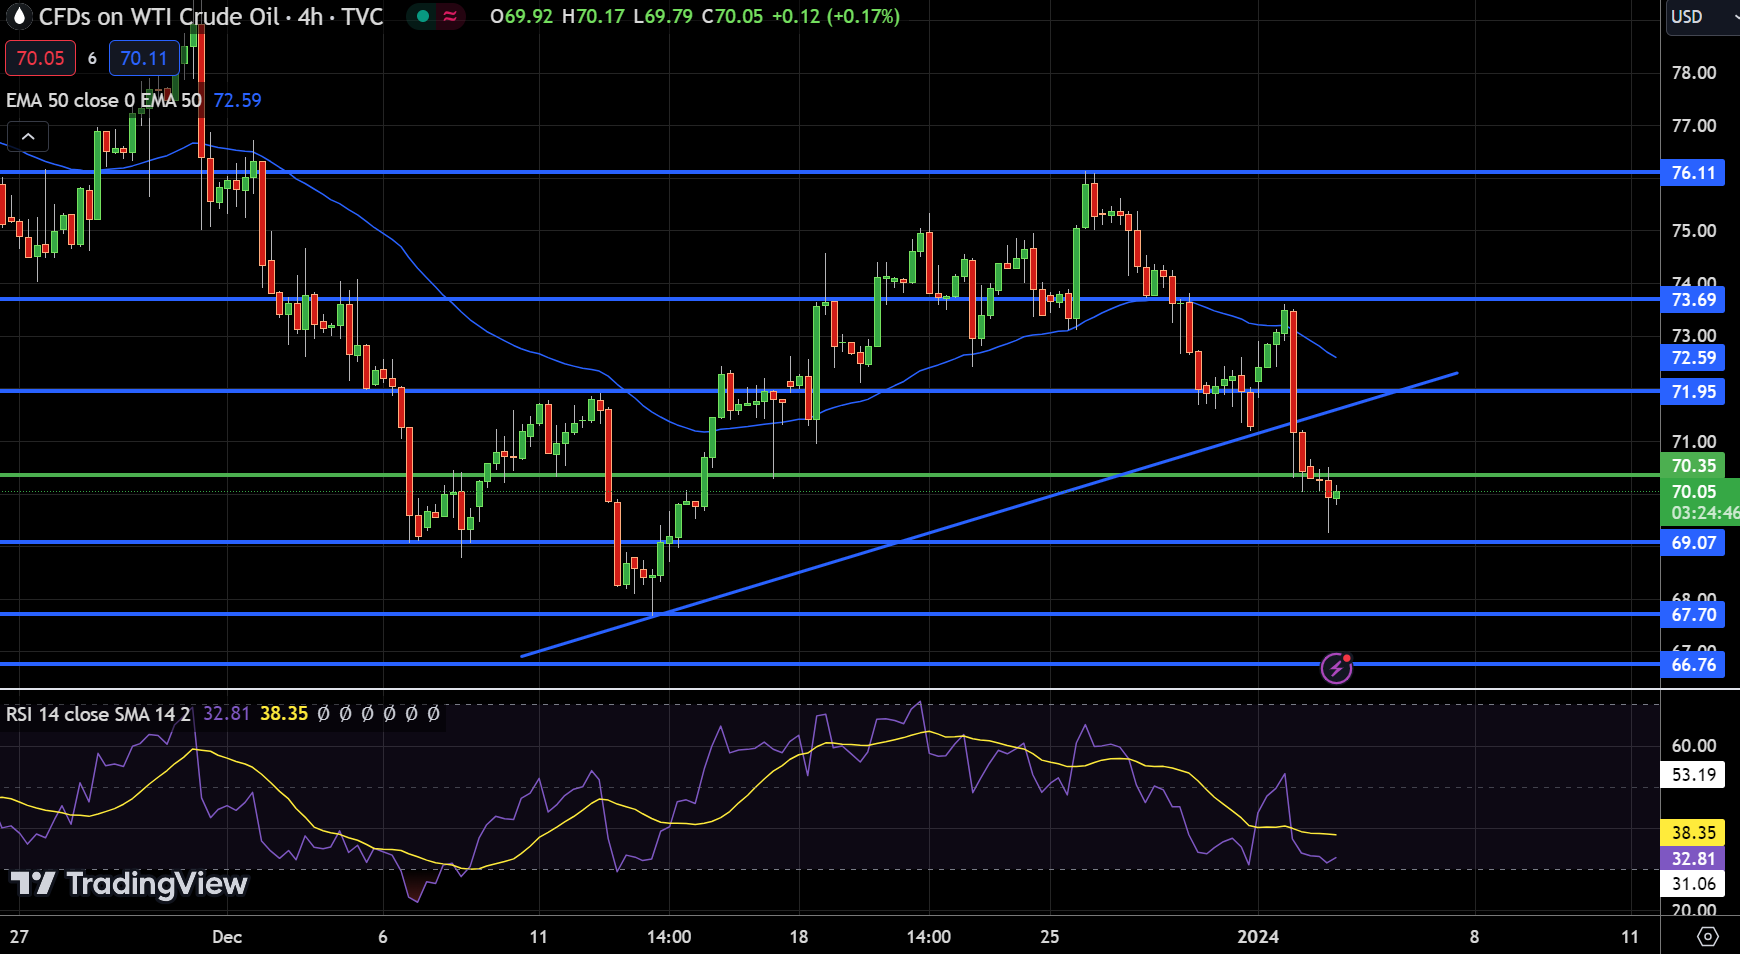
US Oil (USOIL) is currently witnessing a bearish trend, trading at $70.05 with a 0.6% decline. The pivot point is set at $70.05, while immediate resistance levels are identified at $71.95, $73.69, and $76.11.
The asset finds support at lower levels of $69.07, $67.70, and $66.76. The Relative Strength Index (RSI) at 32 suggests a bearish sentiment, inching towards oversold territory. The Moving Average Convergence Divergence (MACD) indicator reflects a negative trend at -0.2300.
Additionally, a bearish engulfing candle pattern near the $71 mark indicates potential downward momentum. Overall, the technical outlook for USOIL remains bearish below the $71 threshold.
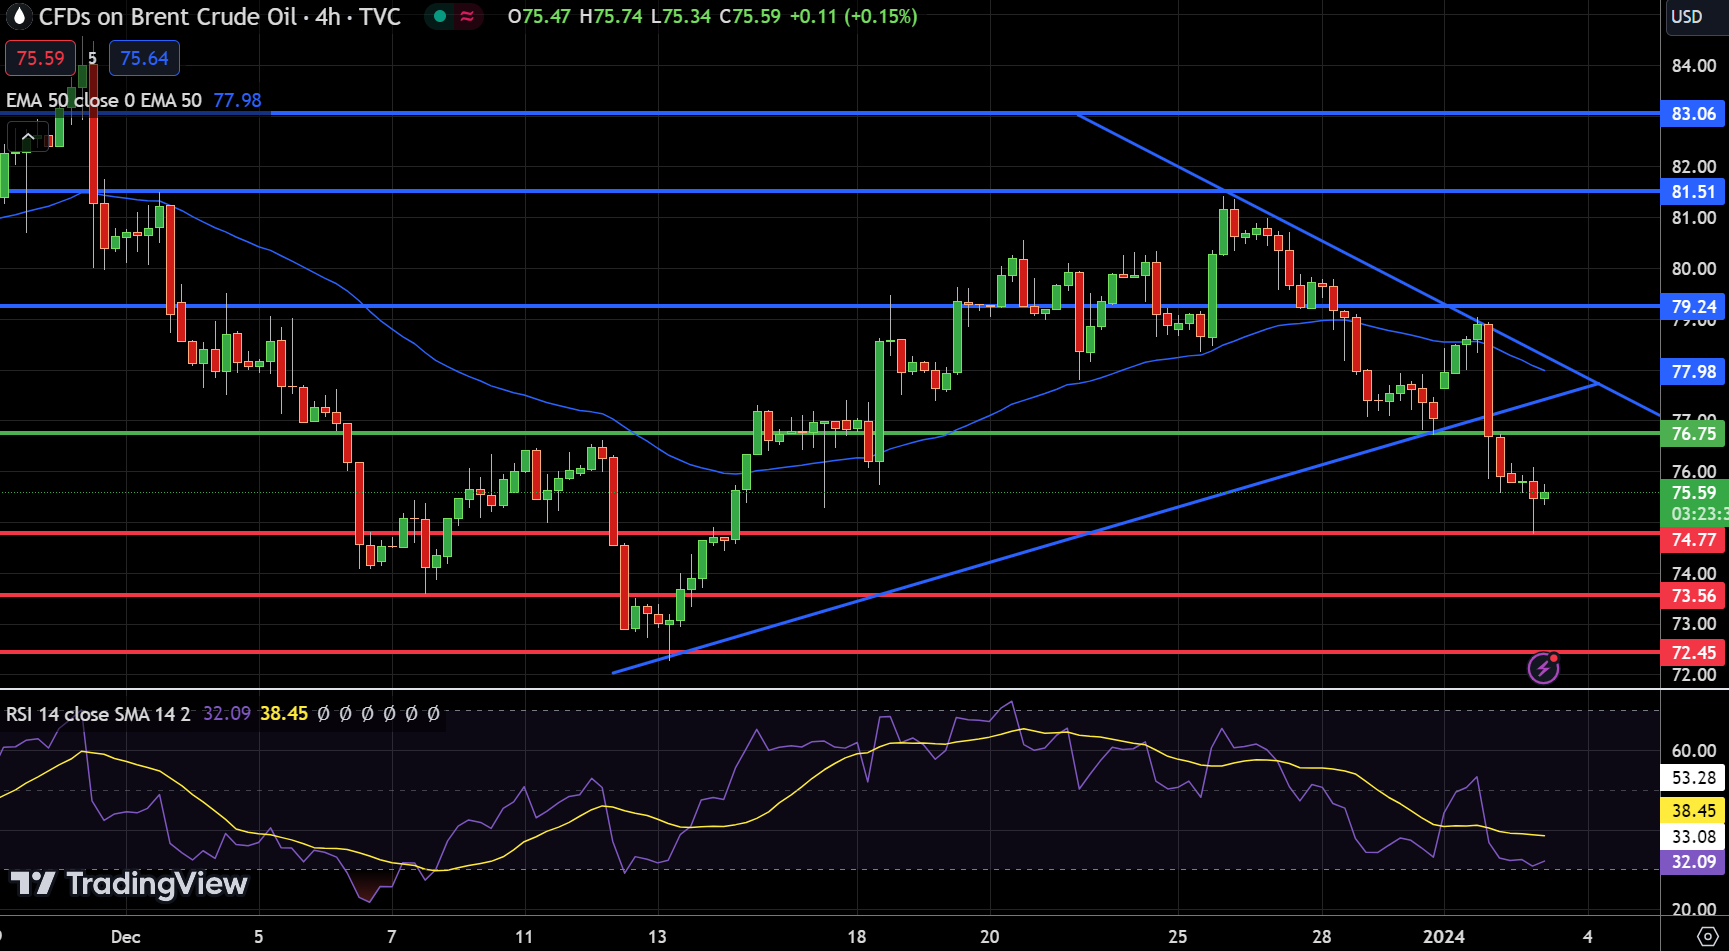
Brent Oil Price Forecast