



Key Insights

- Oil prices drop over 3%, Saudi cuts and OPEC output rise.
- Natural Gas decreases by 3.78%, bearish trend below $2.80.
- US Oil falls to $71.69, technicals suggest bearish outlook.
- UK Oil at $76.68, faces resistance at $79.94.
Quick Fundamental Outlook
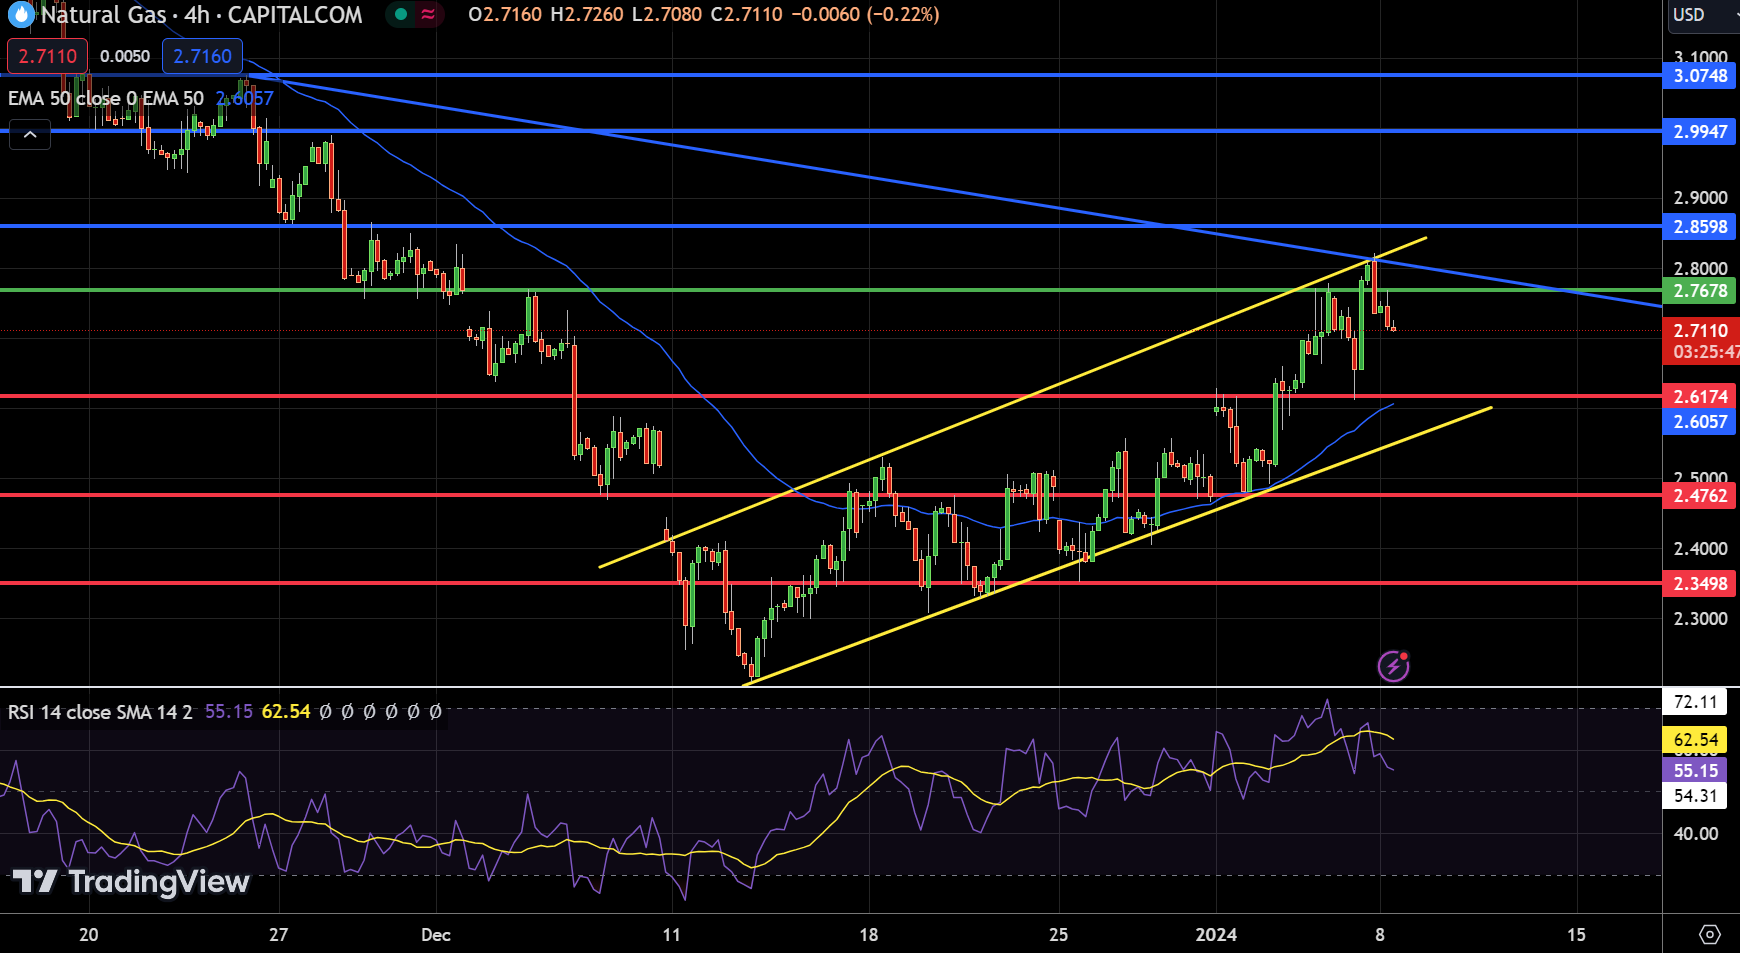
On Monday, January 8, Natural Gas (NG) displayed a pronounced downturn in the commodities market, closing at $2.71, a decrease of 3.78%.
The technical landscape for NG is defined by a pivot point at $2.77, setting the stage for future price movements.
Resistance levels are marked at $2.86, $2.99, and $3.07, indicating potential barriers to upward price trends. Conversely, support levels are identified at $2.62, $2.48, and $2.35, which may offer a foundation for price stabilization in the face of downward pressures.
The Relative Strength Index (RSI) for NG is currently at 55, suggesting a slightly bullish market sentiment. However, NG’s price trajectory below the 50-Day Exponential Moving Average (EMA) of $2.61 signals a short-term bearish trend.
Chart analysis shows an upward channel extending resistance at the $2.80 mark.The closure of a bearish engulfing candle under this trendline indicates a potential shift towards selling, with NG possibly targeting $2.60 as an initial objective.
In summary, the near-term outlook for Natural Gas is tilted towards bearish, particularly if prices remain below the $2.80 threshold.
WTI Oil Price Forecast
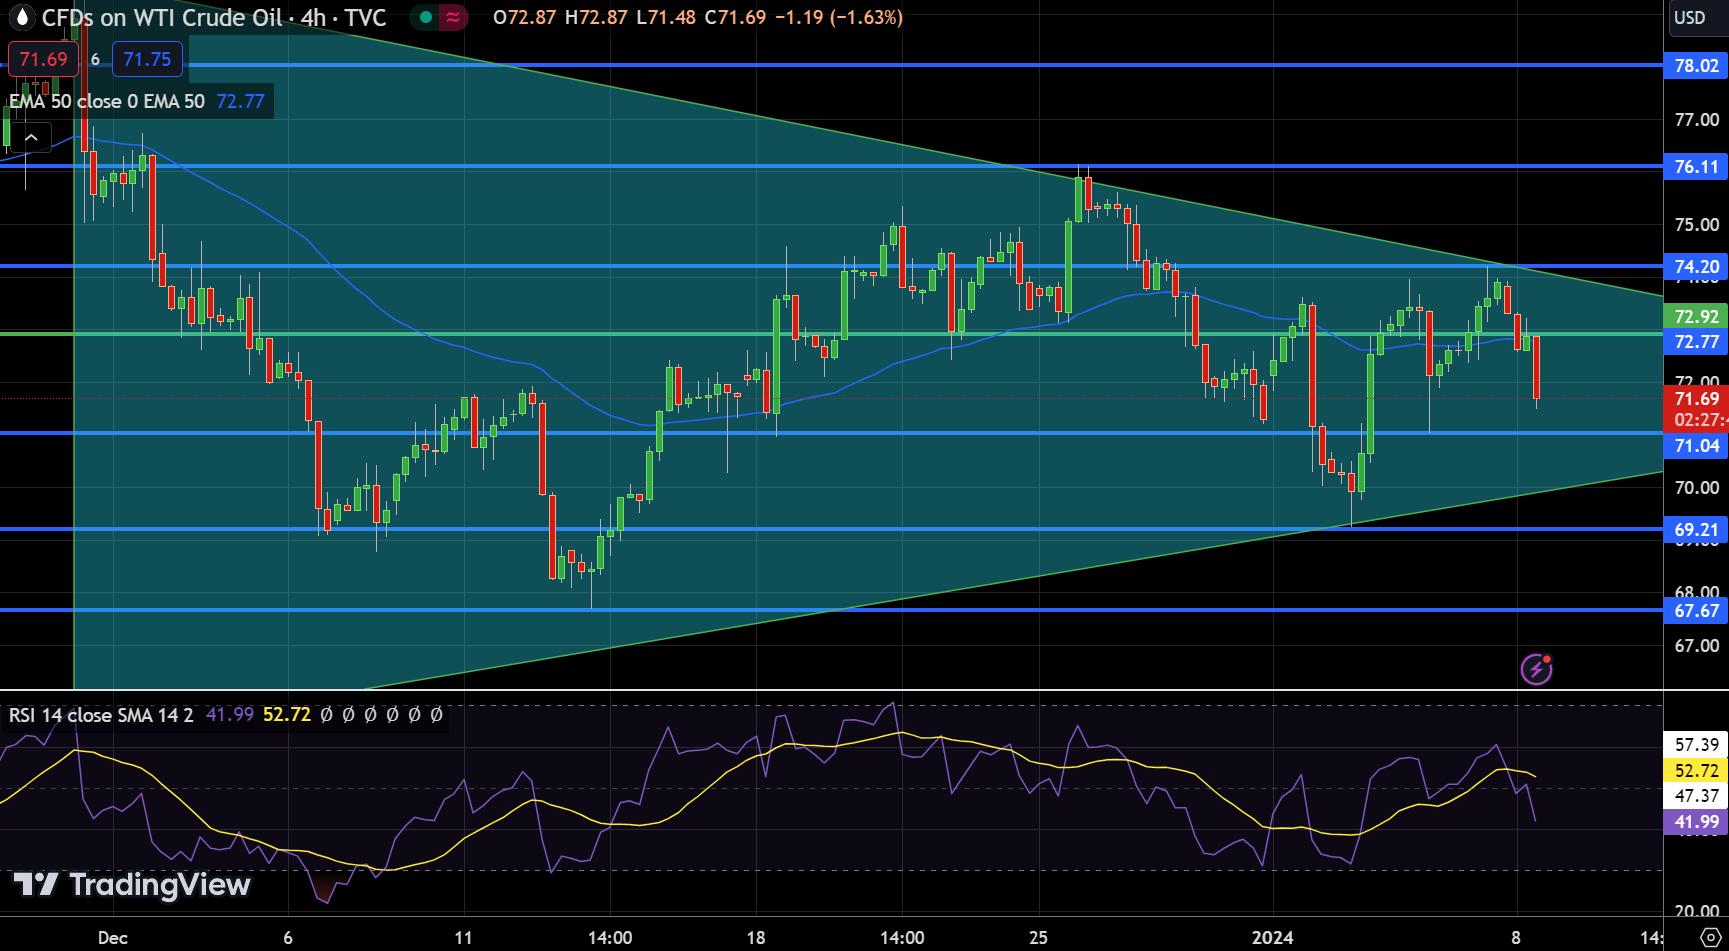
On Monday, January 8, US Oil witnessed a notable decline in the market, trading at $71.69, down by 3.01%. This movement in oil prices is a critical indicator of the ongoing fluctuations in the energy sector.
The technical framework for US Oil outlines a pivot point at $72.92, with immediate resistance levels observed at $74.20, $76.11, and $78.02. These levels could potentially cap any upward momentum. Conversely, the support levels are established at $71.04, followed by $69.21 and $67.67, which might provide a foundation for price stabilization.
The Relative Strength Index (RSI) for US Oil is at 41, indicating a bearish sentiment in the current market. Additionally, the price of US Oil is below the 50-Day Exponential Moving Average (EMA) of $72.77, further suggesting a short-term bearish trend.
Chart analysis reveals a symmetrical triangle pattern, typically indicative of a neutral market stance, supporting US Oil around $70. This pattern suggests a potential breakout in either direction, influenced by market demand and supply dynamics. For the moment, the 50 EMA indicates a selling trend below $72.75.
In summary, the immediate outlook for US Oil appears bearish, especially if prices stay below the $72.75 mark.
Brent Oil Price Forecast
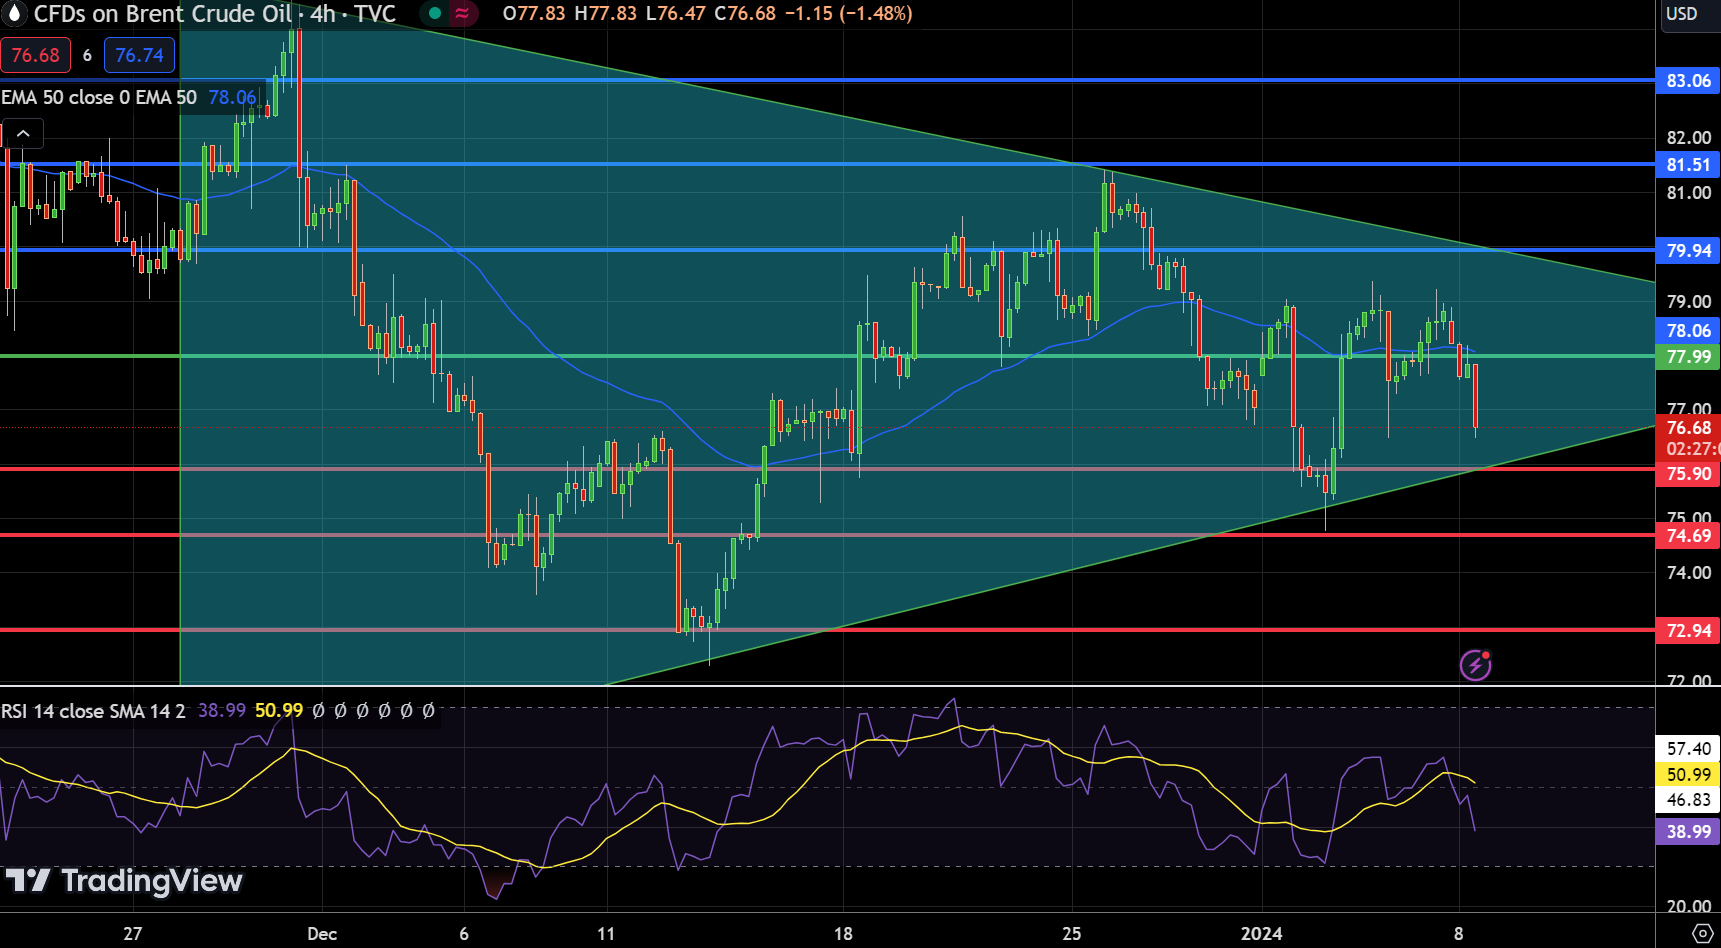
UK Oil (Brent Crude) is currently experiencing a downturn, trading at $76.68, marking a significant 2.78% decline. The pivot point for UK Oil stands at $77.99, a crucial level for understanding its short-term direction.
Resistance levels are observed at $79.94, $81.51, and $83.06, indicating potential hurdles for a recovery in prices. Conversely, support levels at $75.90, $74.69, and $72.94 provide essential cushions against further declines.
The Relative Strength Index (RSI) for UK Oil is at 38, suggesting a bearish sentiment without being in the oversold territory. This indicates potential for further downward movement. Additionally, UK Oil’s current price is below its 50-Day Exponential Moving Average (EMA) of $78.06, reinforcing the short-term bearish outlook.
A symmetrical triangle pattern is observed, providing support around the $75 level with resistance near $80. This pattern typically suggests a neutral bias, with a possibility of breaking out in either direction based on market demand and supply dynamics.
Currently, the 50 EMA suggests a bearish stance below $77.95.
In summary, the technical outlook for UK Oil remains bearish below the $78 mark.


