Key Insights

- Geopolitical tensions boost crude oil prices; Yemen’s Houthis criticize UN resolution.
- Natural Gas encounters bearish pressure at $2.72 amid short-term trend.
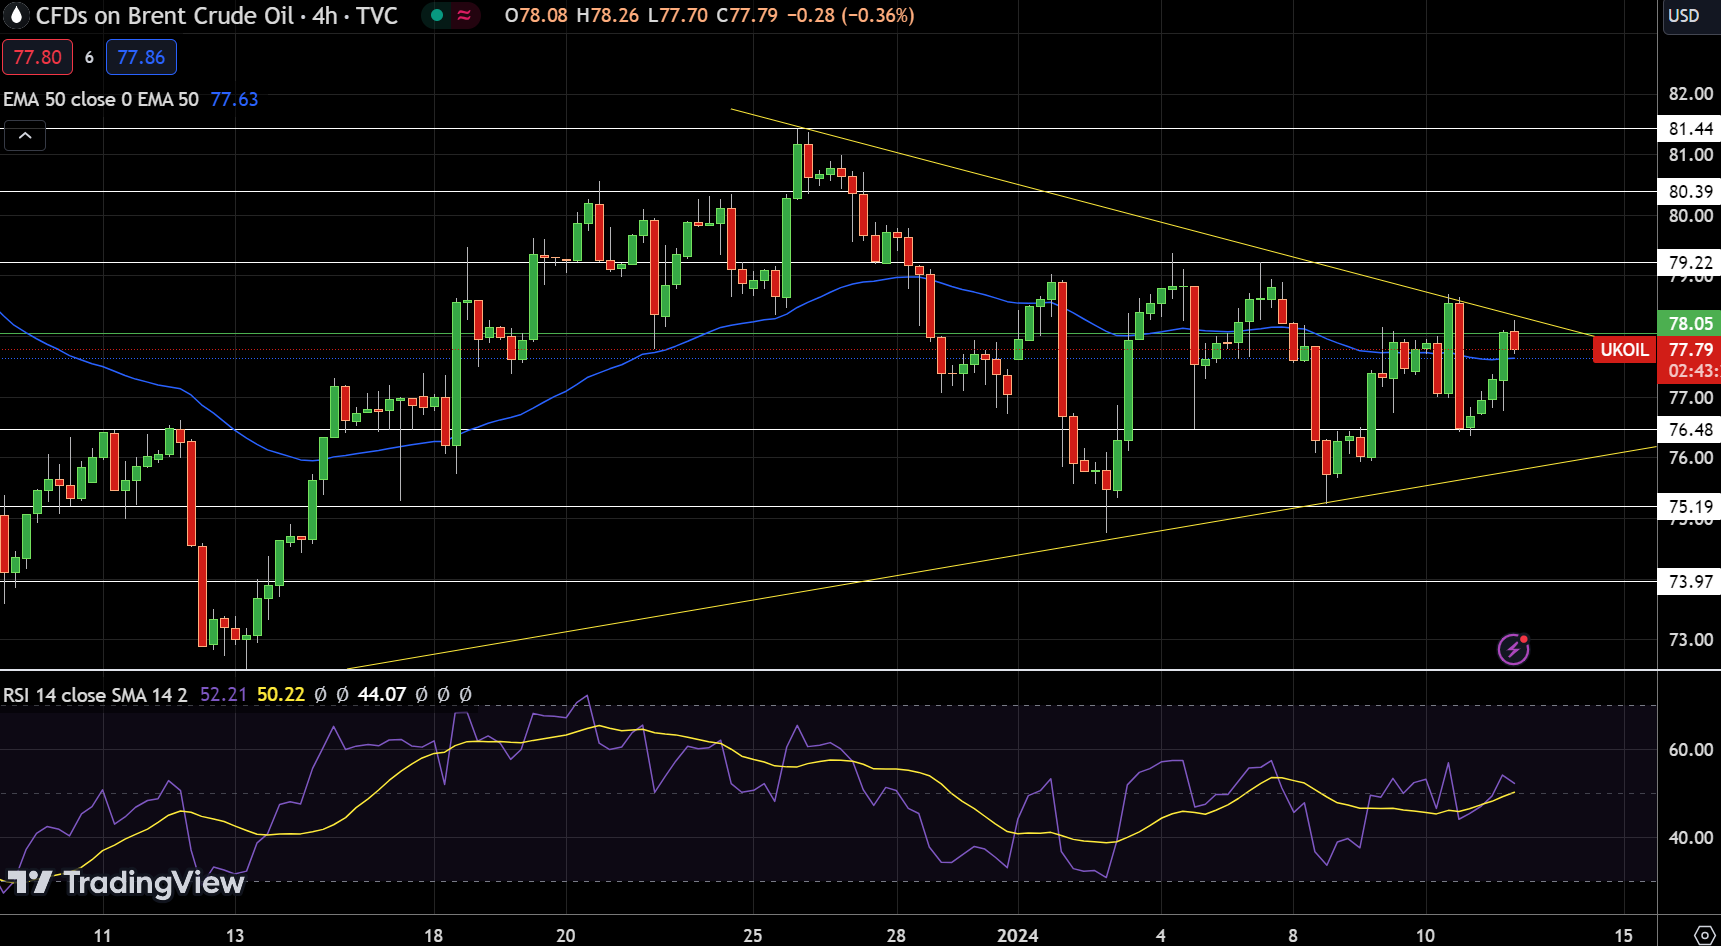
- USOIL consolidates in symmetrical triangle; UKOIL bears cautious below $78.
Quick Fundamental Outlook
Yemen’s Houthi leader, Mohammed Ali al-Houthi, labeled the resolution a “political game” and accused the US of international law violations. Meanwhile, the latest Energy Information Administration (EIA) data showed an unexpected increase in US crude oil stocks, putting downward pressure on WTI prices.
Contrarily, the American Petroleum Institute (API) reported a significant decline in crude stocks. These developments are likely to impact USOIL, UKOIL, and potentially Natural Gas prices, as they reflect shifting supply dynamics and geopolitical tensions affecting the oil market.
Natural Gas Price Forecast
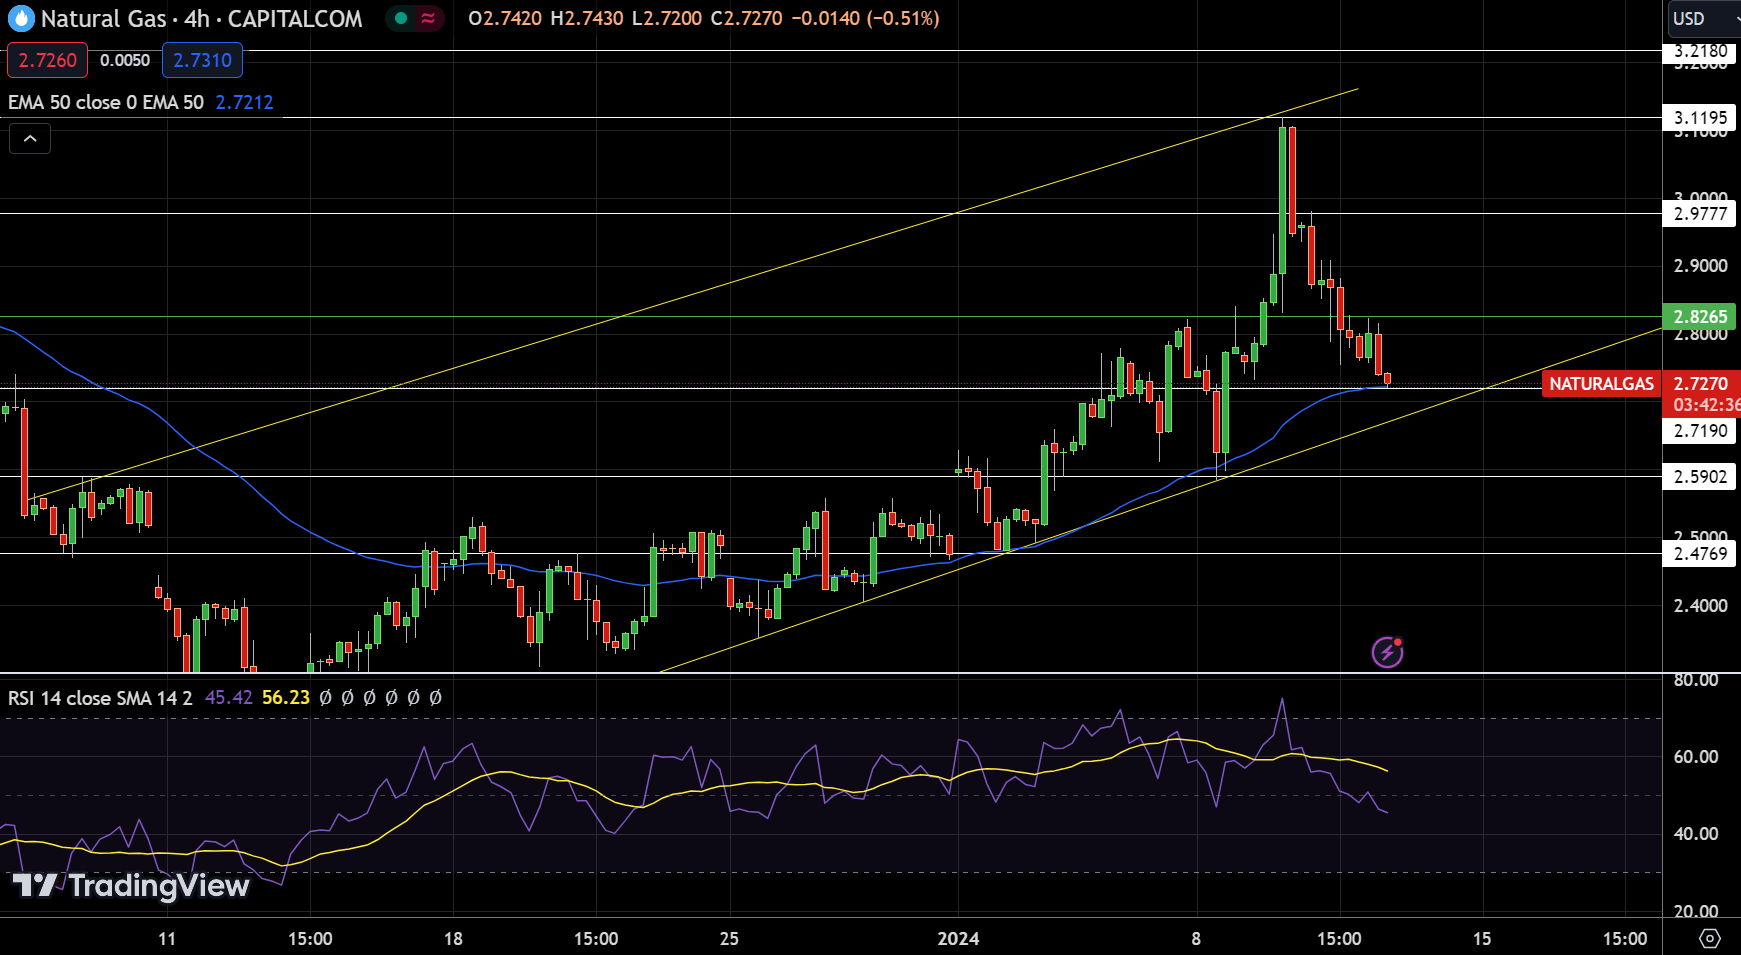
Natural Gas (NG) is currently trading at $2.72, down by 2.40%. The pivot point for today is set at $2.83, with resistance levels identified at $2.98, $3.12, and $3.22. Support levels are positioned at $2.72, followed by $2.59 and $2.48. The 50-Day Exponential Moving Average (EMA) is currently at $2.79, suggesting that NG’s price is below this average, reinforcing a short-term bearish trend.
Chart analysis indicates an upward trendline providing support for NG around the $2.72 level. This technical formation suggests that if NG holds above $2.72, it might exhibit bullish behavior.
In conclusion, NG’s trend appears to be bullish above the $2.72 mark. The asset is expected to test its resistance levels in the short term, particularly around $2.72, which will be crucial in determining its immediate direction.
WTI Oil Price Forecast
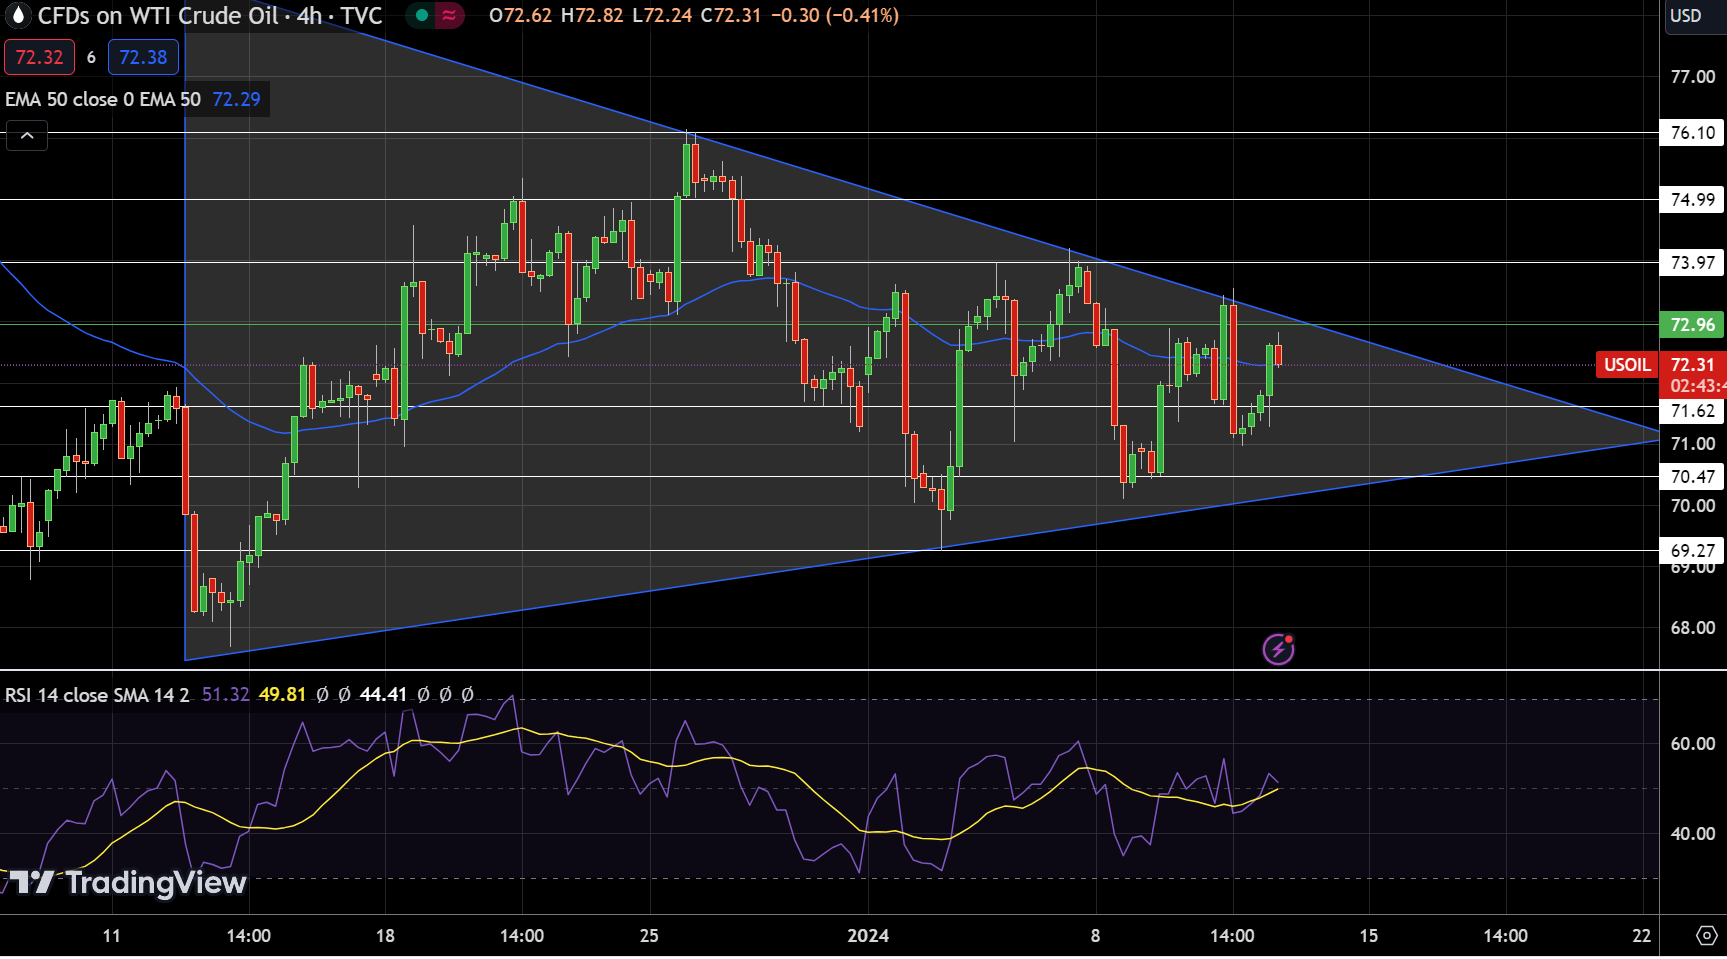
USOIL is currently trading at $72.31, reflecting an increase of 1.89%. The day’s pivot point is $72.96, with resistance levels at $73.97, $74.99, and $76.10. Support is established at $71.62, with further levels at $70.47 and $69.27.
Chart analysis reveals a symmetrical triangle pattern, confining USOIL within a range between approximately $73 and $70.50. This pattern indicates a consolidation phase, with a potential breakout in either direction.
In summary, the outlook for USOIL is tentatively bearish below the $73 level, with near-term price movements likely to test this key resistance.