



Key Insights
- WTI trading around $72.15, influenced by US Dollar’s rebound and easing supply disruption concerns.
- Red Sea tensions diminish, resuming major shipping operations; impacts oil logistics.
- Mixed US crude oil inventory reports: API notes an increase, EIA reports larger-than-expected drop.
- Possible interest rate cuts in Europe and US in 2024 could affect WTI and other USD-denominated commodities.
- Natural Gas starts at $2.47, with RSI at 50 and MACD suggesting a slightly bearish momentum.
Quick Fundamental Outlook

Natural Gas Price Forecast
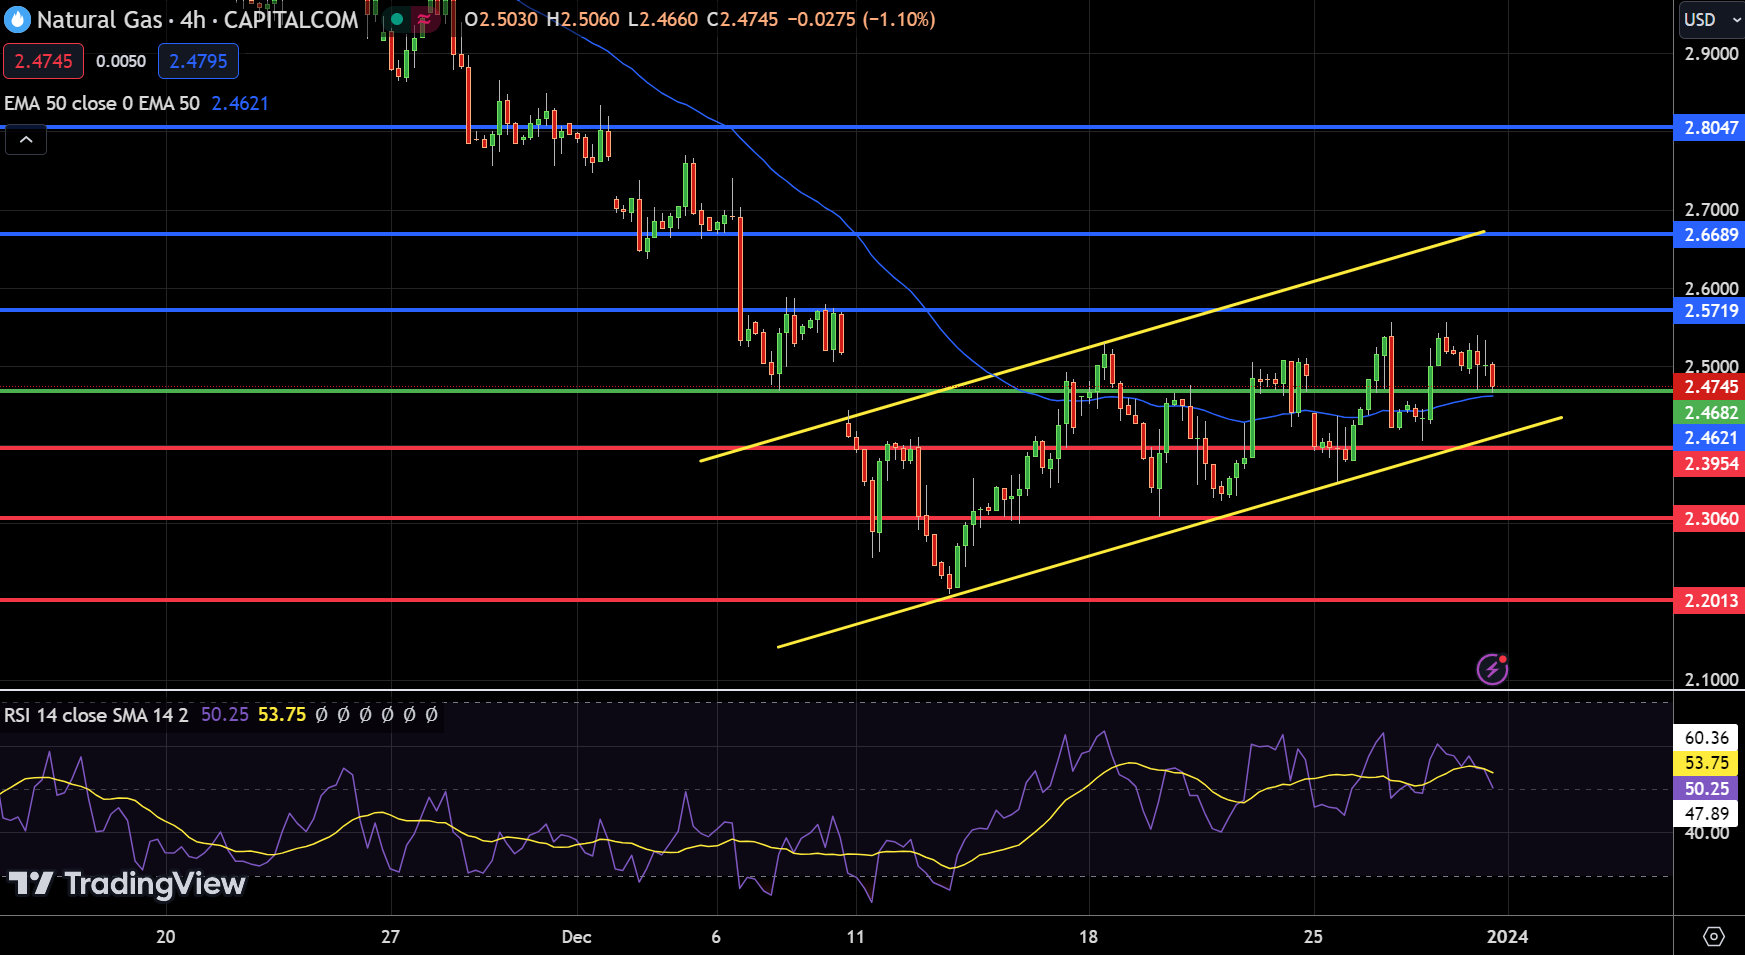
Natural Gas (NG) starts the year at $2.47, experiencing a downturn of 1.81%. The analysis, based on a detailed chart with a focus on key price levels, indicates a pivot point at $2.46. Resistance levels are identified at $2.57, $2.66, and $2.8047, while support levels are found at $2.39, $2.30, and $2.20, offering insights into potential market movements.
The Relative Strength Index (RSI) for NG stands at 50, precisely at the threshold between bullish and bearish sentiments. The Moving Average Convergence Divergence (MACD) presents a nuanced picture with a value of -0.001 and a signal line at 0.017, suggesting a balanced yet slightly bearish momentum.
Notably, NG is trading just above its 50-Day Exponential Moving Average (EMA) of $2.46, which could act as a pivotal point for future price direction. In conclusion, NG presents a cautiously optimistic outlook, being bullish above the critical $2.46 level.
WTI Oil Price Forecast
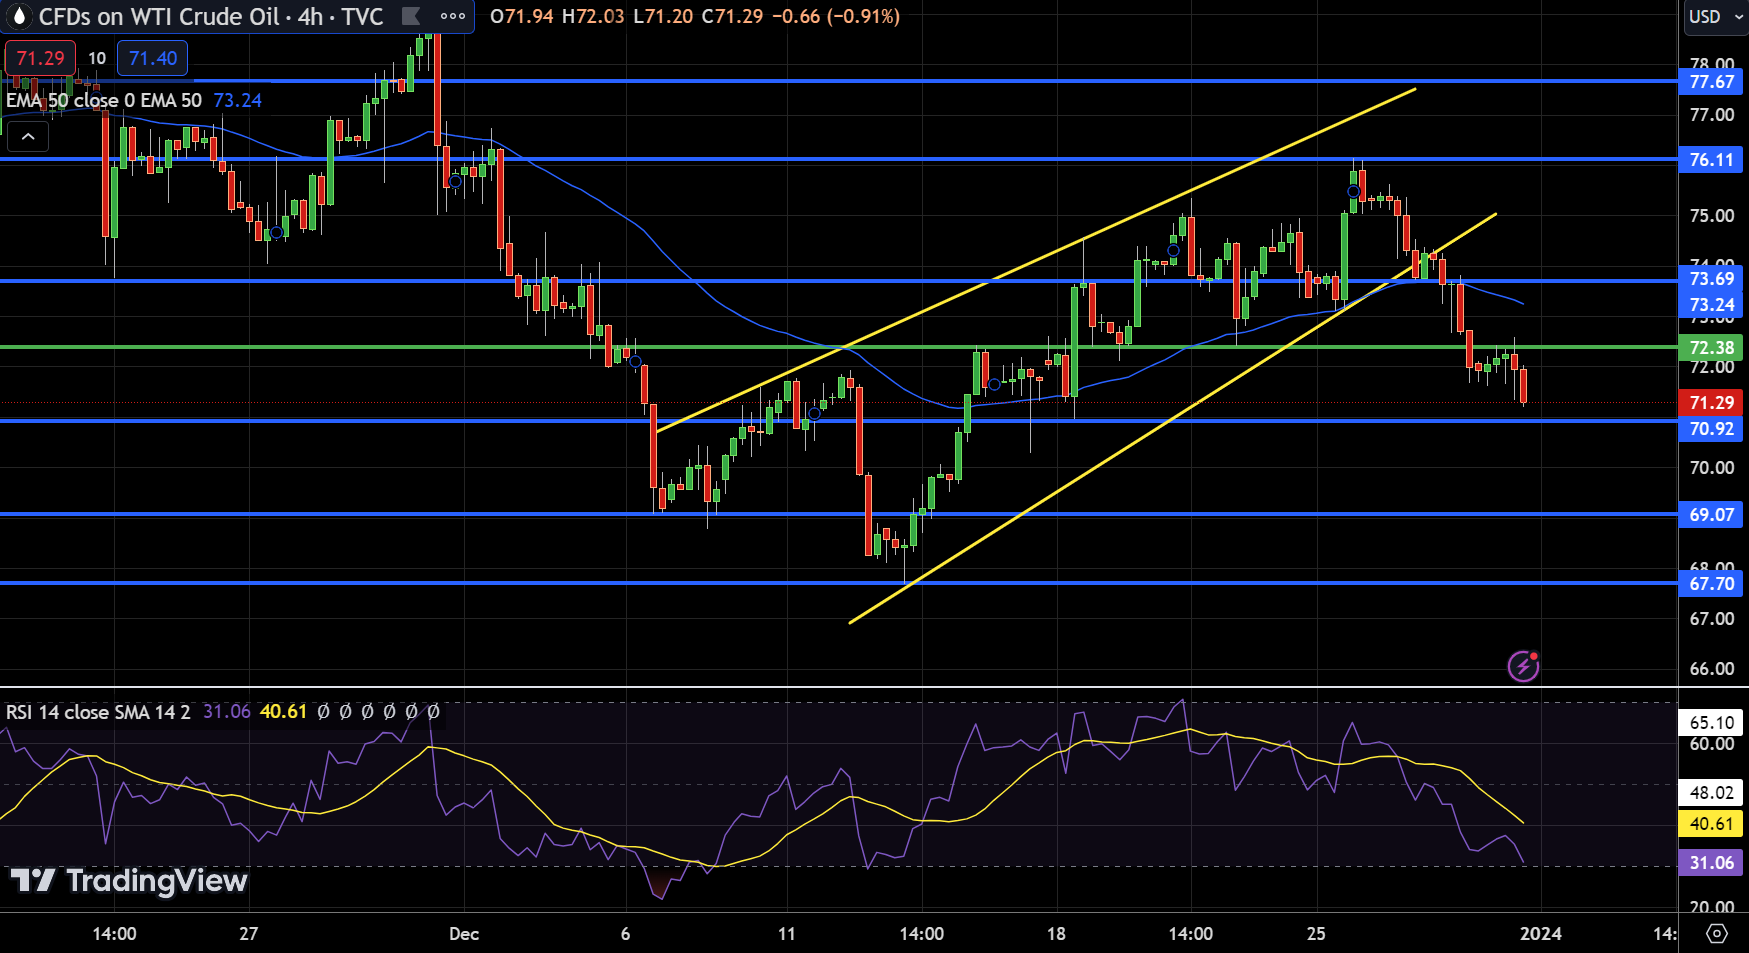
From a technical standpoint, the Relative Strength Index (RSI) sits at 31, suggesting a bearish sentiment as it hovers near the oversold territory. This is further corroborated by the Moving Average Convergence Divergence (MACD), which currently reads -0.270 against a signal line of -0.620, indicating a potential downward momentum.
Notably, USOIL is trading at the 50-Day Exponential Moving Average (EMA) of $70.92, reinforcing the short-term bearish outlook. The chart patterns reveal a bearish engulfing candlestick formation below $72.40, hinting at a continuation of the downtrend. This bearish pattern, coupled with the technical indicators, suggests a cautious approach for traders and investors.
In conclusion, the overall trend for USOIL appears bearish, particularly if prices remain below the $70.95 mark.
Brent Oil Price Forecast
For a look at all of today’s economic events, check out our economic calendar.


