
Cooler Forecasts Broke the Weather Rally Before Buyers Could Build It
Nymex Natural Gas gapped lower Monday and the move was immediate. Weekend weather models pulled the heat out of the Midwest and Northeast right when buyers needed it most. The market had been trying to base above recent lows last week with elevated temperatures and a large short position that looked vulnerable. None of that mattered once the forecast shifted. Sellers gapped the market through support on the opening and the main trend is still pointed down with the 50-day moving average a long way overhead.
At 13:15 GMT, September natural gas futures were trading at $2.668 per million British thermal units, down $0.065 or 2.38%.

Daily September Natural Gas Futures Technical Analysis
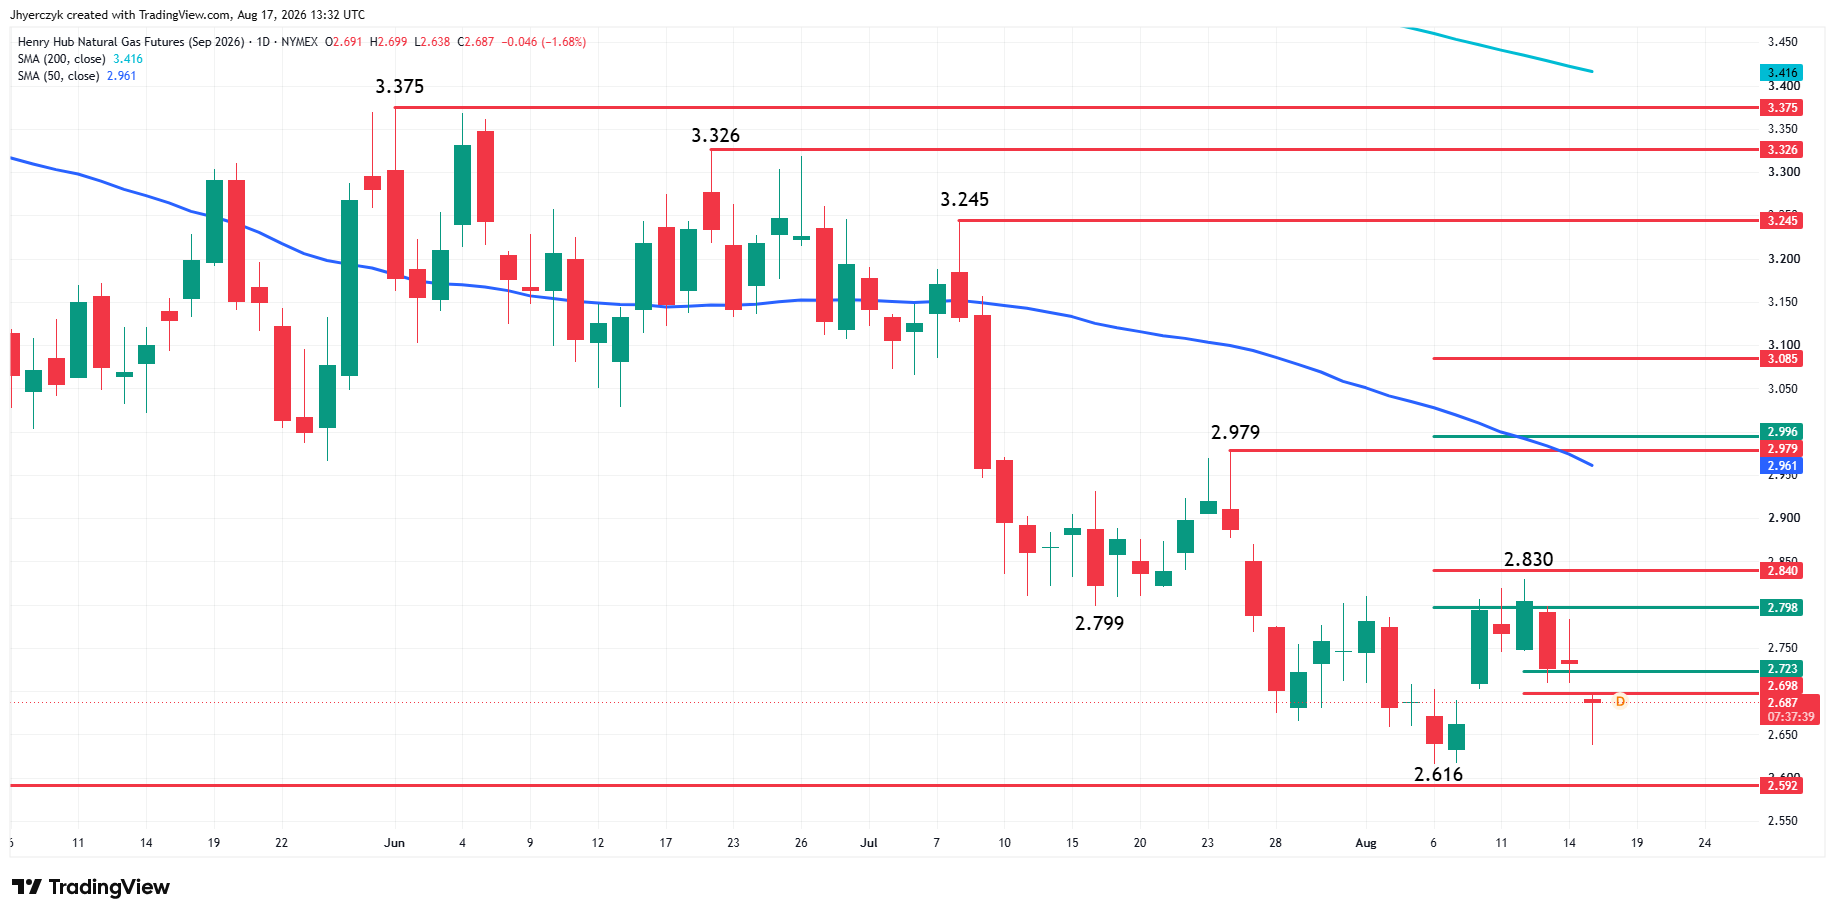
September natural gas futures are weak on Monday after gapping lower on the opening. The early move gapped through the short-term retracement zone at $2.723 to $2.698 before hitting an intraday low at $2.638. This was slightly above the August 6 bottom at $2.616. The retracement zone is new resistance.
The main trend is down. Buyers will have to overcome the swing top at $2.830 to change the main trend to up. The major resistance and trend indicator remains the 50-day moving average at $2.961.
Record Output and Reduced Exports Are Flooding the Same Market
Lower-48 production averaged around 111.3 Bcf per day in August. Prices are near multi-month lows and output has not flinched. Shale wells keep producing. Associated gas from Permian oil drilling keeps adding supply whether the gas market wants it or not.
Freeport LNG made it worse. Maintenance started in July and is expected to run into late August, taking roughly 2 Bcf per day of export capacity offline. Feedgas deliveries to the nine major U.S. LNG plants averaged near 17.1 Bcf per day so far this month, below July levels. Gas that would normally be moving into an export terminal is staying home, adding to a domestic market that was already oversupplied before a single compressor went down at Freeport.
Natural Gas Price Forecast
Every new Natural Gas analysis as it publishes, today's technical signal and key levels, live price — on one page.
See all Natural Gas forecastsEurope’s lower storage levels can pull harder on U.S. exports once the maintenance wraps up. That trade is weeks away. Monday’s trade is 111 Bcf per day of production hitting a market where 2 Bcf per day of export demand just went missing.
The supply picture only gets more difficult from here. September brings weaker cooling demand. Winter heating is still months away. Freeport has not fully returned. Producers are still drilling. The market has weeks to keep piling gas into storage before anyone needs to pull meaningful volumes back out, and Monday’s gap lower says traders are not waiting to see how high the pile gets.
The Storage Build Keeps Getting Bigger While the Calendar Runs Out on Bulls
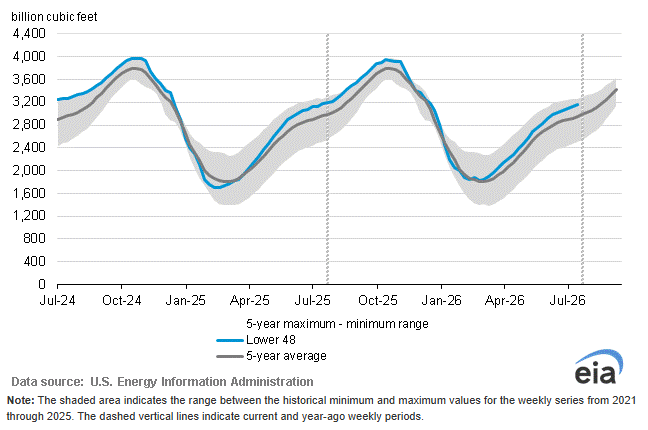
The EIA reported a 36 Bcf injection for the week ended August 7. Traders expected 30 to 32 Bcf. Working gas in storage hit 3,153 Bcf, now sitting 198 Bcf above the five-year seasonal average, a 6.7% surplus that has been growing through the exact stretch of summer that was supposed to shrink it.
Last week had everything going for the bulls. Temperatures were elevated. Electricity demand was strong. There was a crowded short position that could have been squeezed. The storage report came in above expectations anyway. The market absorbed the heat and still injected more gas than anyone expected. That is the number that matters more than any forecast model.
Now the forecasts are turning cooler across the Midwest and Northeast heading into the final stretch of August. The calendar is already working against buyers. The EIA expects inventories to reach about 3,985 Bcf by the end of October, the highest pre-winter storage level in 10 years. Sellers do not need October to arrive before they trade that number. They are already positioned for it.
The burden is entirely on buyers to prove the EIA number is too high. Nothing in the data is helping them make that argument.
What to Watch
Weather runs this market until the next EIA report lands. The cooler models over the weekend did the damage and another revision in the same direction keeps sellers on Monday’s gap. Buyers are stuck. They need a hotter forecast, stronger feedgas out of Freeport, or a storage number that finally surprises to the downside. None of those showed up this week. Record production, 3,153 Bcf in storage and 2 Bcf per day of missing LNG export capacity are all pointed the same direction heading into the weakest stretch of the calendar.
The trend is down and the gap confirmed it Monday morning. The market gapped through the retracement zone that had been holding and turned it into resistance. Buyers have to show they can hold the recent lows before anyone starts talking about a change in direction. Until the storage data or the weather models shift, rallies are giving sellers better entries.
More Information in our Economic Calendar.