
LNG and Heat Lifted Gas but Storage Still Runs the Trade
September Nymex natural gas settled higher Friday after stronger LNG feedgas and a hotter weather outlook brought short covering behind Thursday’s storage-driven selloff. The bounce was real but it did not change the near-term balance. Storage is above normal, production is running near 111 Bcf per day and another 1.5 Bcf per day of Permian supply reaches Henry Hub next month. The market is still trading below the 50-day moving average and the downtrend has not been challenged.
September natural gas futures finished at $2.66, up 2.2 cents or 0.83%. The contract bounced after dropping to a 3.25-month low Thursday when a larger-than-expected storage build reminded the market that summer demand has not tightened the balance enough to force buyers higher.

Daily September Natural Gas Futures Technical Analysis
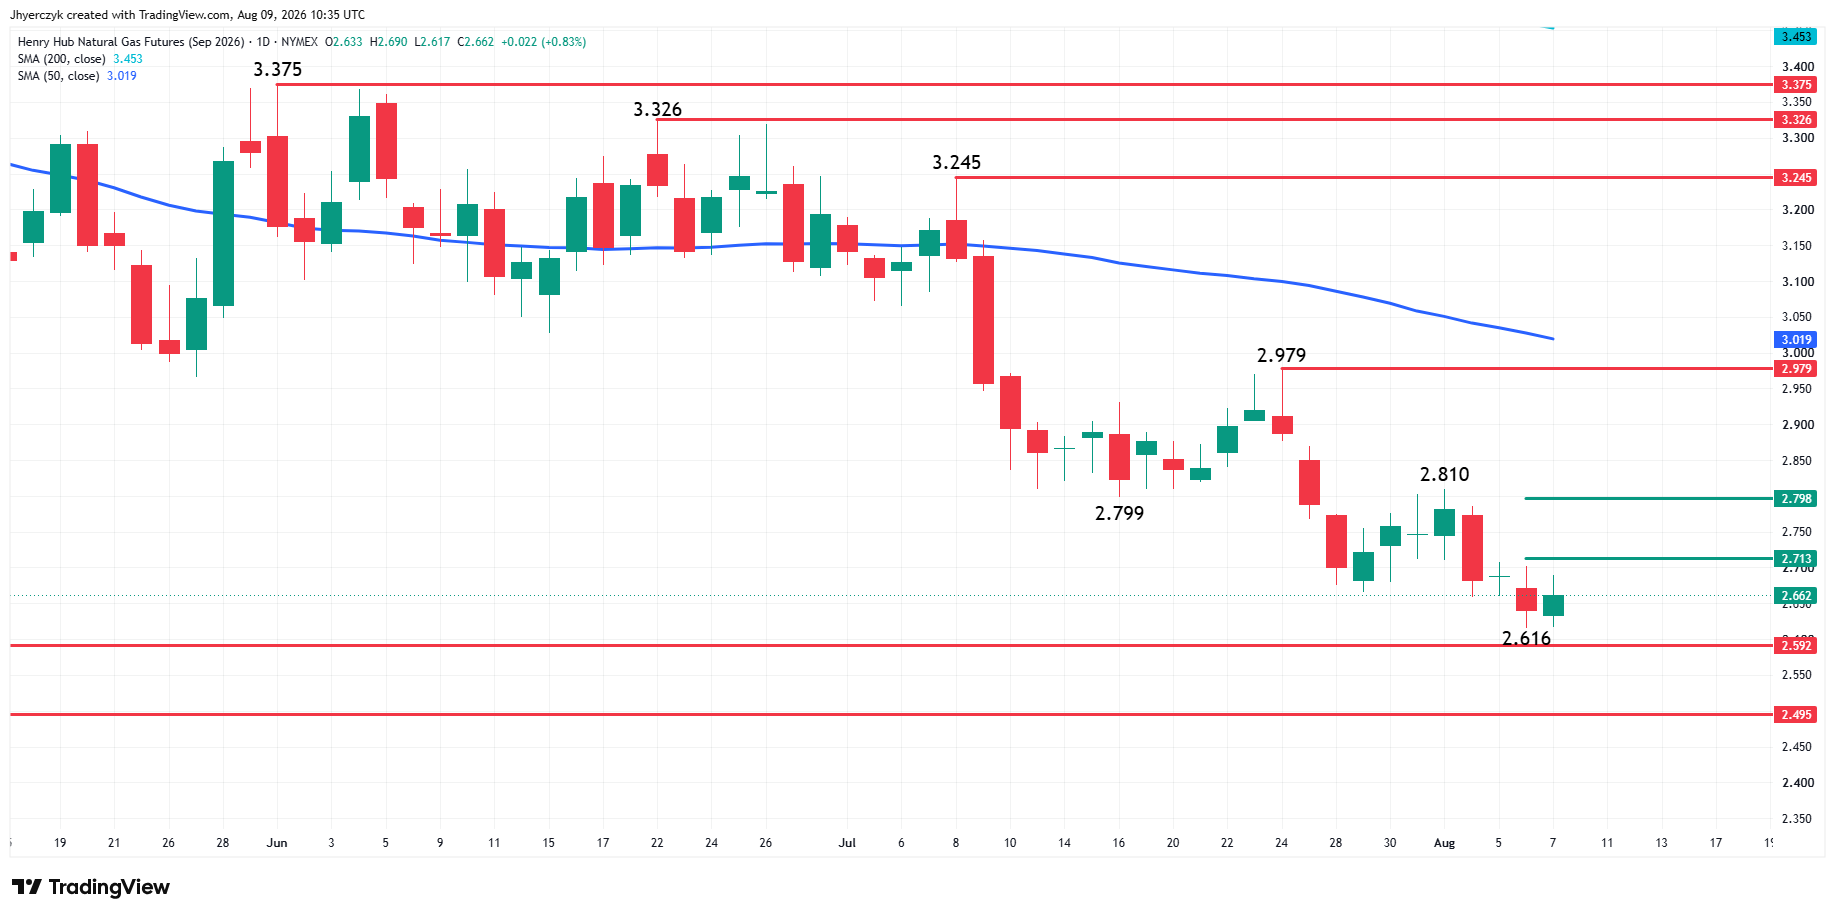
September natural gas futures ended Friday’s session higher after posting an inside move. This usually indicates trader indecision and impending volatility.
The main trend is down according to the daily swing chart. A trade through $2.616 will signal a resumption of the downtrend. The main trend will change to up if buyers can take out the last swing top at $2.810.
Long-term support levels are $2.592 and $2.495. Nearby pivot-price resistance levels are $2.713 and $2.798.
There is nothing really exciting about this chart pattern. Trend traders can easily build a case for the downtrend to resume under $2.616. Counter-trend traders can easily build a case for a bottoming formation, too. But I think the key will be sustaining a change in trend either over a swing top or the 50-day moving average at $3.019.
The 50-day MA has been relatively flat to lower since the market plunged on July 9. Based on that chart pattern, the moving average should be shifting sharply lower at the end of the month, which will bring it closer to the real market and make it more vulnerable to an upside breakout.
Natural Gas Price Forecast
Every new Natural Gas analysis as it publishes, today's technical signal and key levels, live price — on one page.
See all Natural Gas forecastsU.S. LNG Exports Are Rising and Europe Needs Every Cargo
Estimated LNG feedgas rose to 18.6 Bcf per day Friday, the strongest reading in four weeks. Every unit flowing into export terminals is gas leaving the domestic system, and that is the best number buyers have right now.
The pull has a reason behind it. European storage was 58% full as of August 4, well below the five-year seasonal average of 74%. Europe is looking at winter with less gas in the ground than normal, and that keeps the incentive alive for U.S. cargoes.
Weather also gave buyers something to work with Friday. The latest forecast called for most of the country to run hot to very hot over the next seven days, with temperatures reaching the upper 80s to 110s. The Northeast and West are expected to stay above normal through August 12. That is the pattern that lifts gas-fired power generation because utilities burn more fuel to meet air conditioning load.
The market had been waiting for that forecast to show up. Friday it did, and shorts covered after Thursday’s inventory report. But one forecast update is not a trend. The heat has to persist long enough to show up in the weekly supply numbers.
Hugh Brinson Pipeline Adds More Supply Into a Surplus
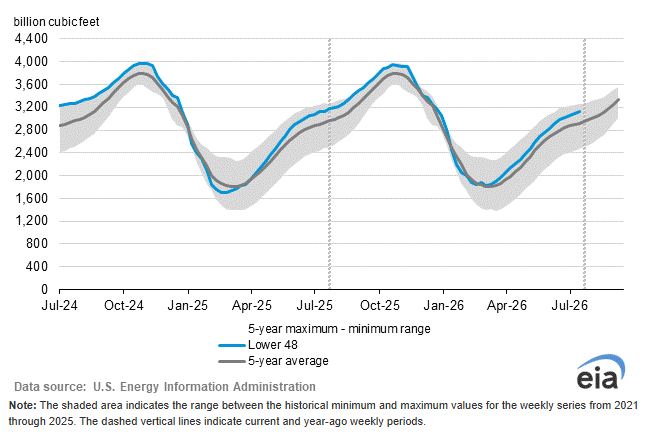
Thursday’s EIA report is the problem buyers cannot get around. Natural gas inventories rose by 33 Bcf for the week ended July 31. The market expected 30 Bcf. The five-year average build for the period was 23 Bcf.
That is not a tight number. Inventories were down slightly from a year ago but stood 6.7% above the five-year seasonal average. The market can bounce on feedgas and forecasts for a session. It needs repeated smaller builds to change the argument for the rest of the summer.
Production is doing its part to keep the surplus in place. Lower-48 dry gas output was 111.2 Bcf per day Thursday, up 1.8% from a year earlier. The Baker Hughes gas rig count dropped by three to 124 in the latest week, but that is not a number that shifts production expectations.
Then the Hugh Brinson pipeline. Energy Transfer said the line reaches its full capacity of 1.5 Bcf per day by September 1. That puts more Permian gas on a direct path to Henry Hub just as the summer cooling season starts to fade. The supply side is not rolling over. It is adding another source of gas when the market needs demand to carry the entire load.
SpaceX and Amazon Are Bypassing the Grid With Gas Power
The longer-term demand story is building and it is not just LNG. SpaceX plans to construct natural gas power plants for its Terafab semiconductor facility in Texas, with the first phase carrying a price tag near $17 billion. The company is not waiting for the grid. It plans to bring its own power to serve SpaceX and xAI data centers.
Amazon is doing the same thing in Pecos County, Texas, financing a private gas power plant tied to a new data center campus. The proposed GW Ranch project could generate 7.65 gigawatts from 35 turbines.
Those are large numbers but they are not September contract numbers. Permits, construction timelines, turbine deliveries and operating rates all sit between announcement and gas burn. The point is simpler. The grid cannot connect new AI data centers fast enough and the hyperscalers are turning to gas turbines because they need reliable power now.
SpaceX, Amazon, xAI, Google, Meta, Microsoft and Oracle are all part of that push. It creates a domestic demand base that did not exist at this scale a few years ago, but it does not remove the storage surplus sitting on this contract today.
What to Watch
Friday’s bounce came from LNG flows and heat. The next storage report is the test. If the build comes in below expectations, the market has a reason to hold the bid. If it prints heavy again, sellers will press the rally back toward Thursday’s lows.
Crude oil staying low removes one source of energy inflation pressure but also keeps the broader commodity complex from giving natural gas a sympathy bid. The longer-term demand from AI power buildouts and rising LNG exports is becoming harder to dismiss, but neither is moving enough gas right now to offset what storage and production are doing to the front month.
The downtrend is intact and the 50-day moving average at $3.019 is the level that defines whether the selling pressure shifts. The swing chart needs a trade through $2.810 to change the trend, and until that happens, rallies are running into a market where sellers have the structural edge.
More Information in our Economic Calendar.