



Oil News: Hormuz Risks and U.S. Jobs Data Keep Energy Markets on Edge
U.S. and worldwide crude fundamentals remain tied to the still incomplete recovery of Persian Gulf exports after months of disruptions along the Strait of Hormuz. In early August, shipping activity remained low compared to pre-conflict standards. West-to-east liquid tanker movement has also remained low. If successful, the Iran-Oman talks are expected to provide an easing of restrictions for transit. In July, OPEC+ production targets were raised, and Gulf producers were expected to have raised production, but still remained well short of previous levels. New production coming from the U.S., Brazil, and Guyana helped abide the then current conditions.
According to the Aug. 1 report from the Energy Information Administration, z.S. crude inventories expected to decline instead increased and exceeded 407 million barrels. Crude inventories at the Cushing hub were also increased. Current inventories are at the five-year seasonal average for commercial crude but remain well below the five-year seasonal average for gasoline and distillates. This is a result of high utilization of the refineries. After earlier releases, the holdings of the Strategic Petroleum Reserve are near their post 9/11 lows. While supply recovery is expected, analysts say the market is still volatile to shocks as the physical market has not yet been balanced.
Natural gas provides a more favorable view domestically, while providing constrained conditions globally. U.S. working natural gas in storage increased to 3,117 billion cubic feet, rising by 33 billion during the week ending July 31. The five-year average surplus expanded by 195 billion cubic feet. Storage builds have been supported by strong production and aggressive LNG feedgas demand, despite summer demand from the power sector. In the rest of the world, the conflict in the Middle East has continued to impact loaded LNG supply resources, which leave ports worldwide.
The International Energy Agency speculates that demand for gas globally will slightly decline. In the Gulf, where LNG demand is negative, new resources in North America, Africa, and Australia, will keep the overall demand for LNG relatively the same, unless there are further delays in recovery in the remaining countries.
Natural Gas Technical Analysis: Bears Maintain Control Below Key Moving Averages
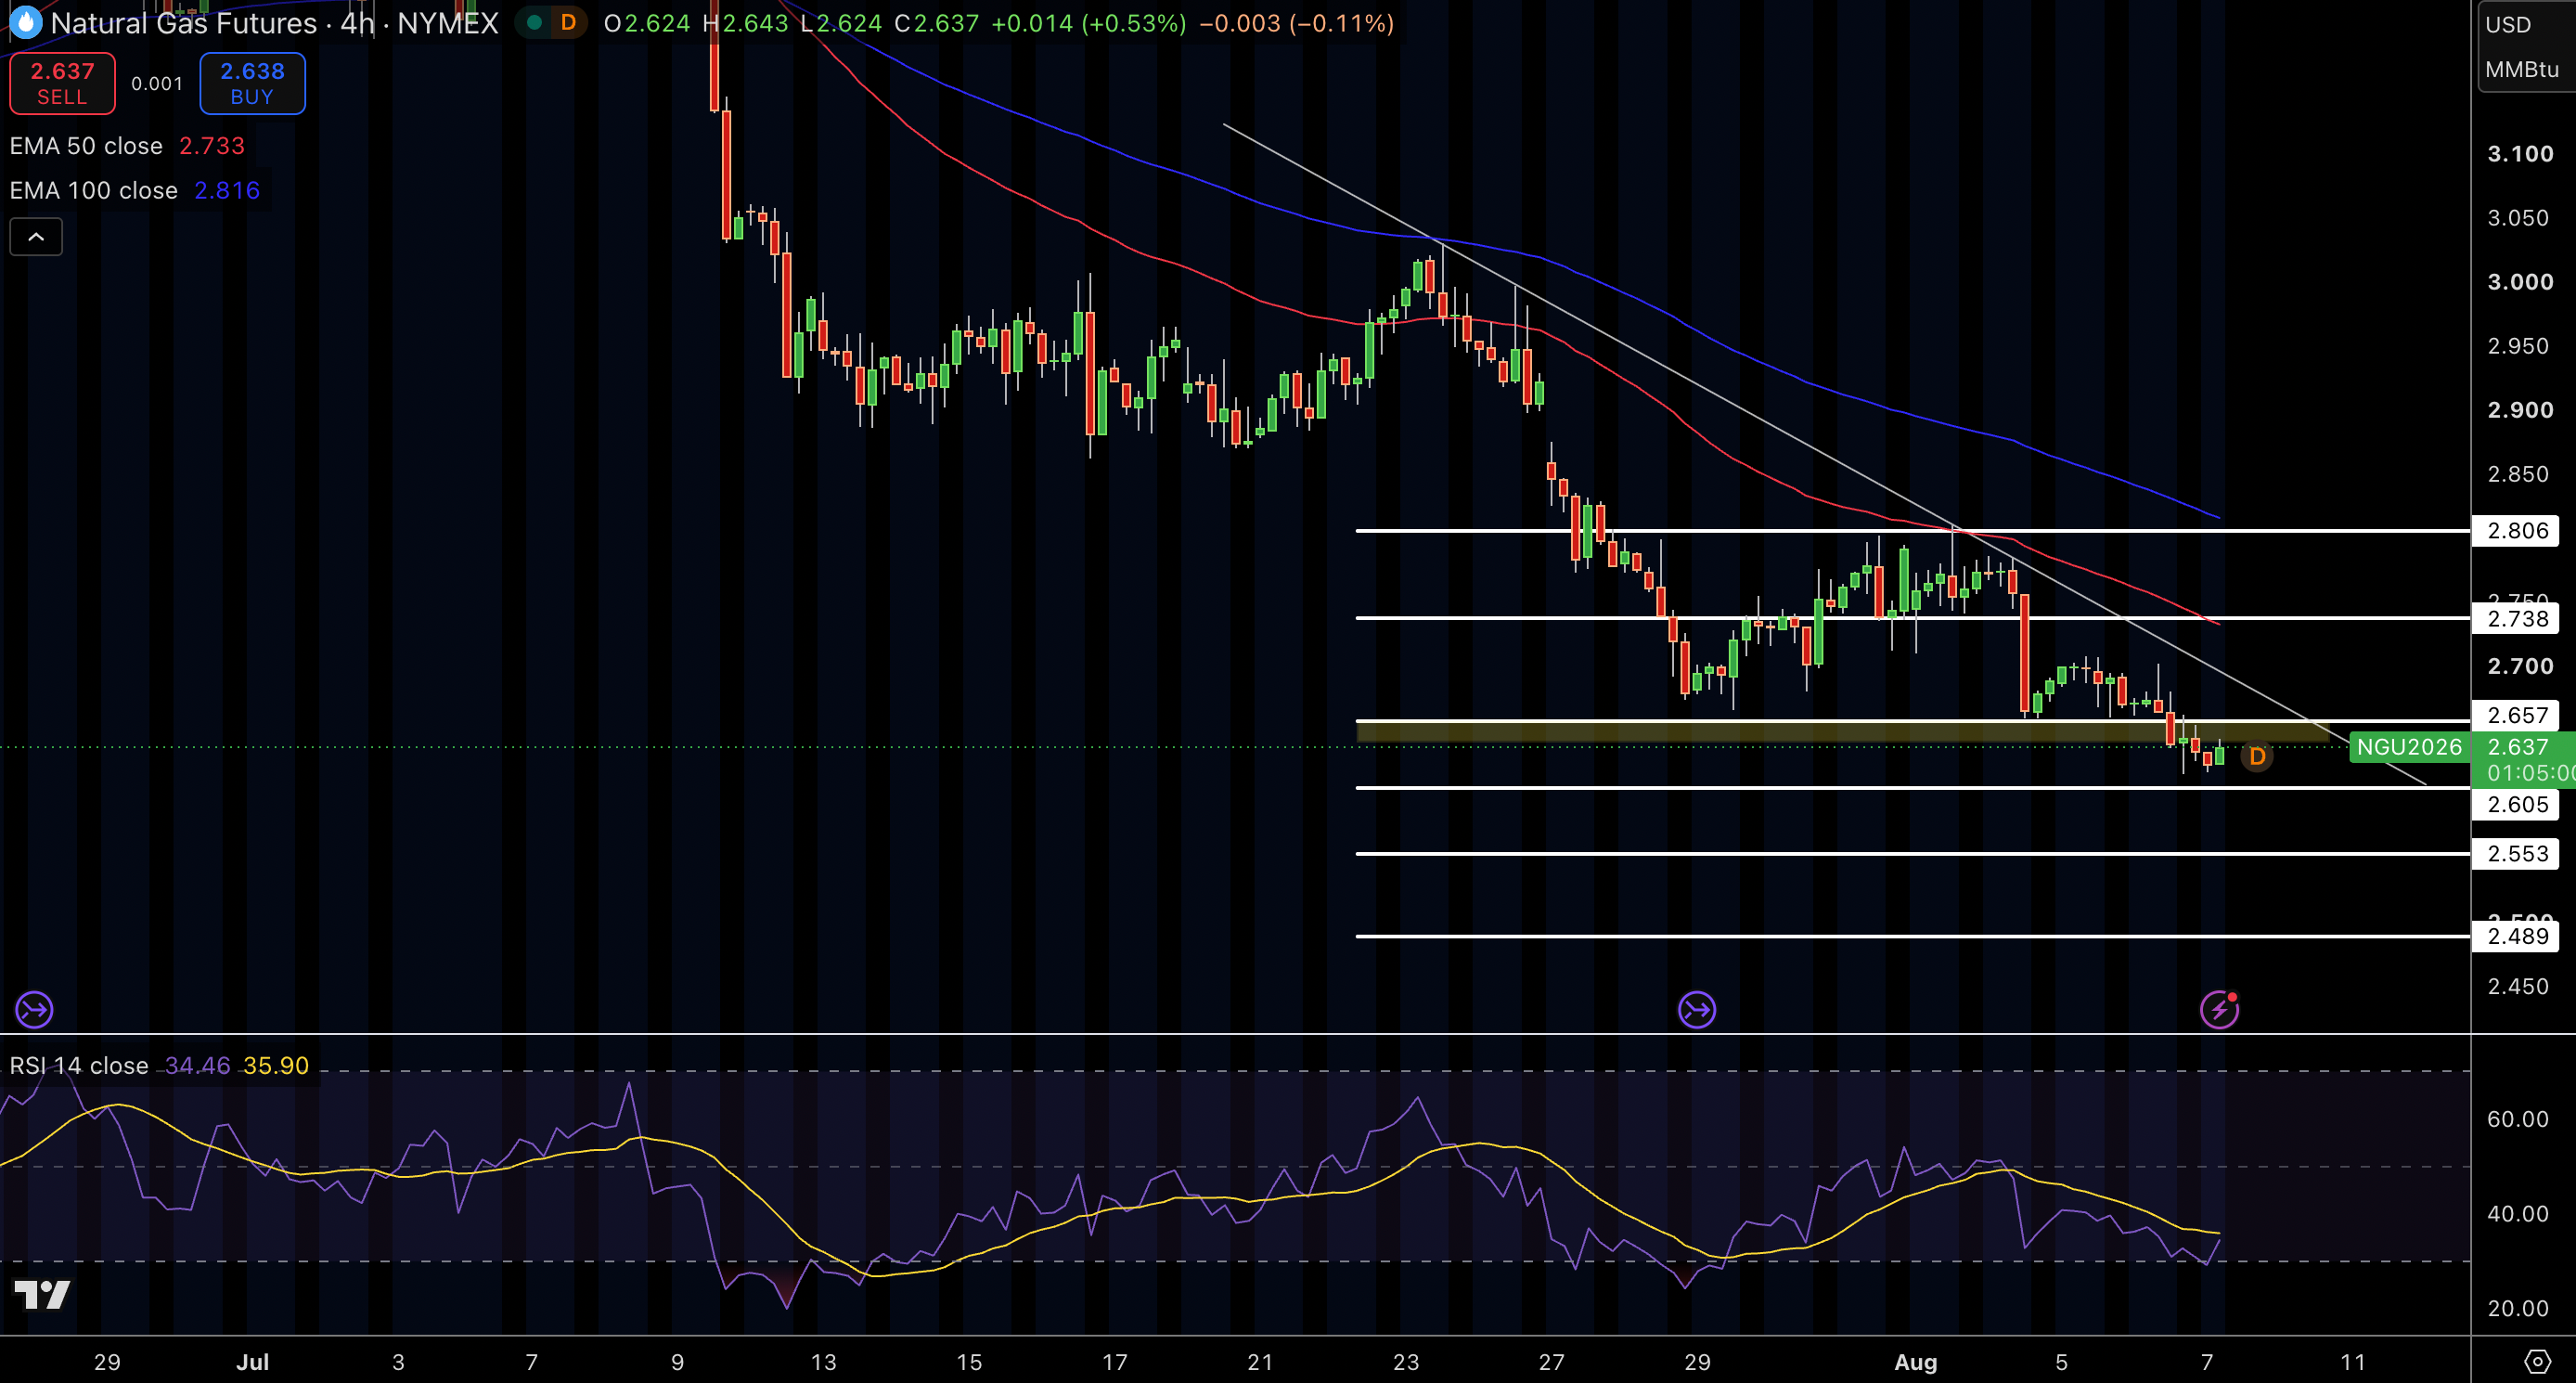
Natural Gas is trading at around $2.64 as it continues to be rejected by the descending trendline, and continues to remain below the 50-period ($2.73) and 100-period ($2.82) EMAs. Prices are trading near a weak support of $2.65, where buyers have not generated a meaningful breakout. RSI remains weak at 34 with a strong bearish push.
A close below $2.60 will push the price to $2.55 and $2.49. If price improves to above $2.65, gas will be trading at $2.74, however, a break above $2.81-$2.82 will be the first indication of a bullish trend. Until then, rising prices will be rejected by the descending trendline.
Natural Gas Price Forecast
Every new Natural Gas analysis as it publishes, today's technical signal and key levels, live price — on one page.
See all Natural Gas forecastsWTI Crude Oil Technical Analysis: WTI Rebounds but Faces Descending Trendline Resistance
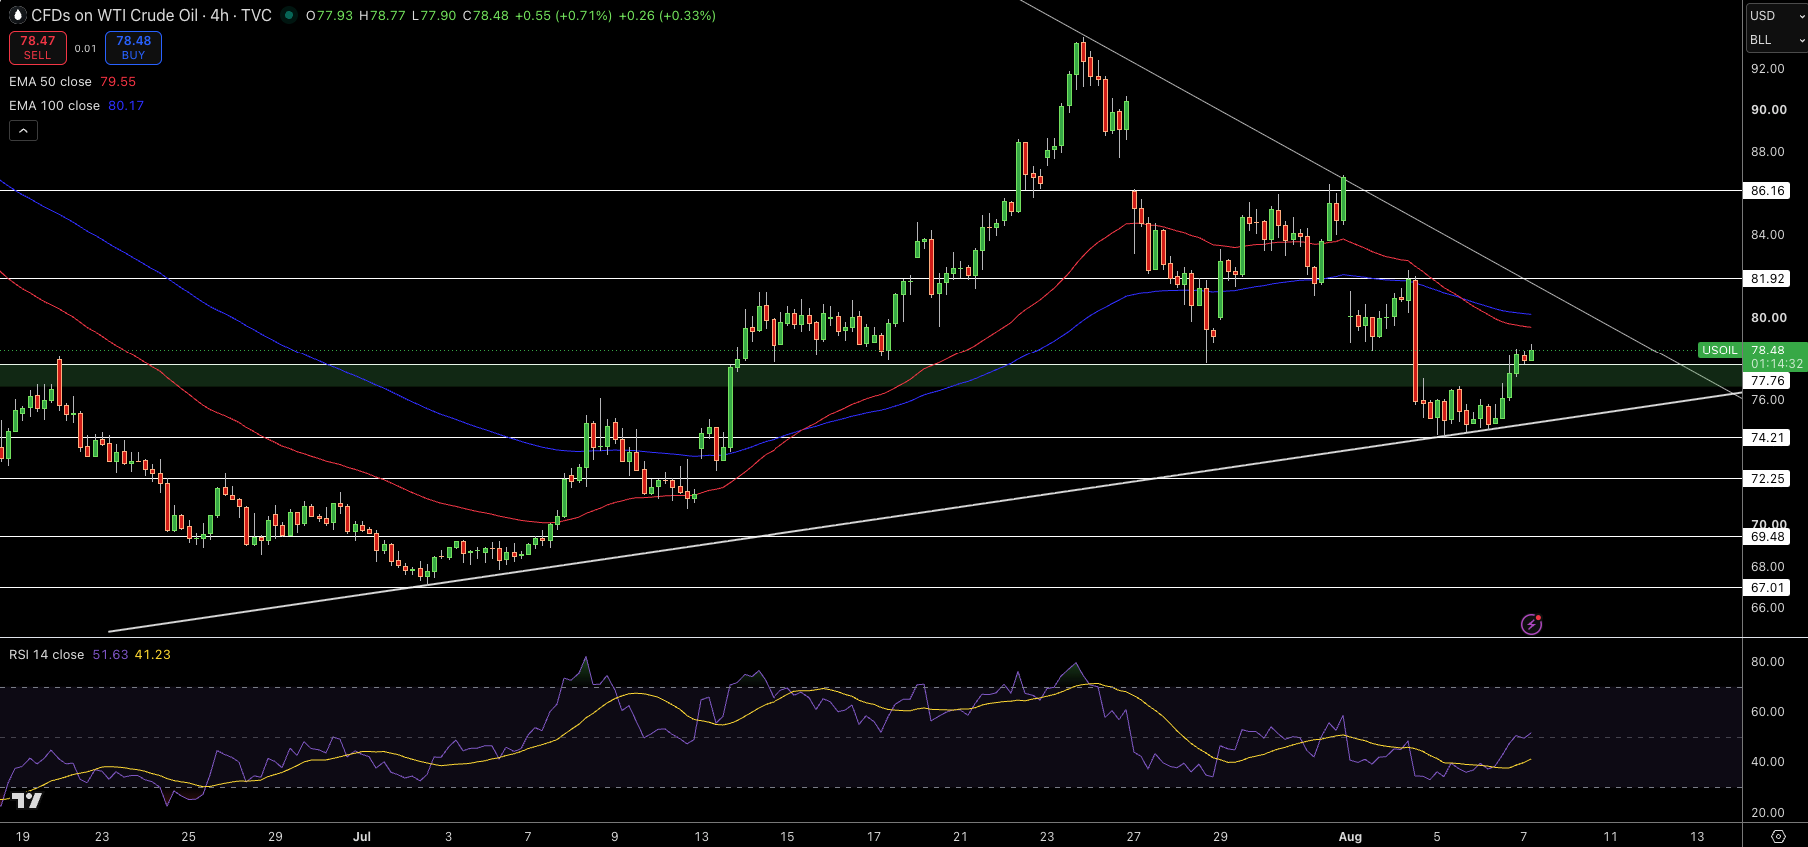
After a bounce from the $74.20 support, WTI is trading close to $78.48. The balance covers the key demand zone near $77.75. Prices remain below the 50 and 100-period EMAs. There is resistance, and the trend stays cautious. However, demand has pushed WTI back above the most recent breakout level. Prices continue to approach a long-term descending trend line.
Strong resistance is between $79.50 and $80.00 due to the descending trend line. The RSI has crossed the mid level and supports further bullish movement since it is now above 51. If prices rise above the resistance zone, the trend line and prices potentially reach $81.92 and $86.16.
There is further resistance and support near $77.75 and $74.21. Although the trend has changed for the better, the trend line and further resistance must be overcome for bullish movement to be confirmed.
Brent Crude Technical Analysis: Brent Extends Recovery Above 50-EMA
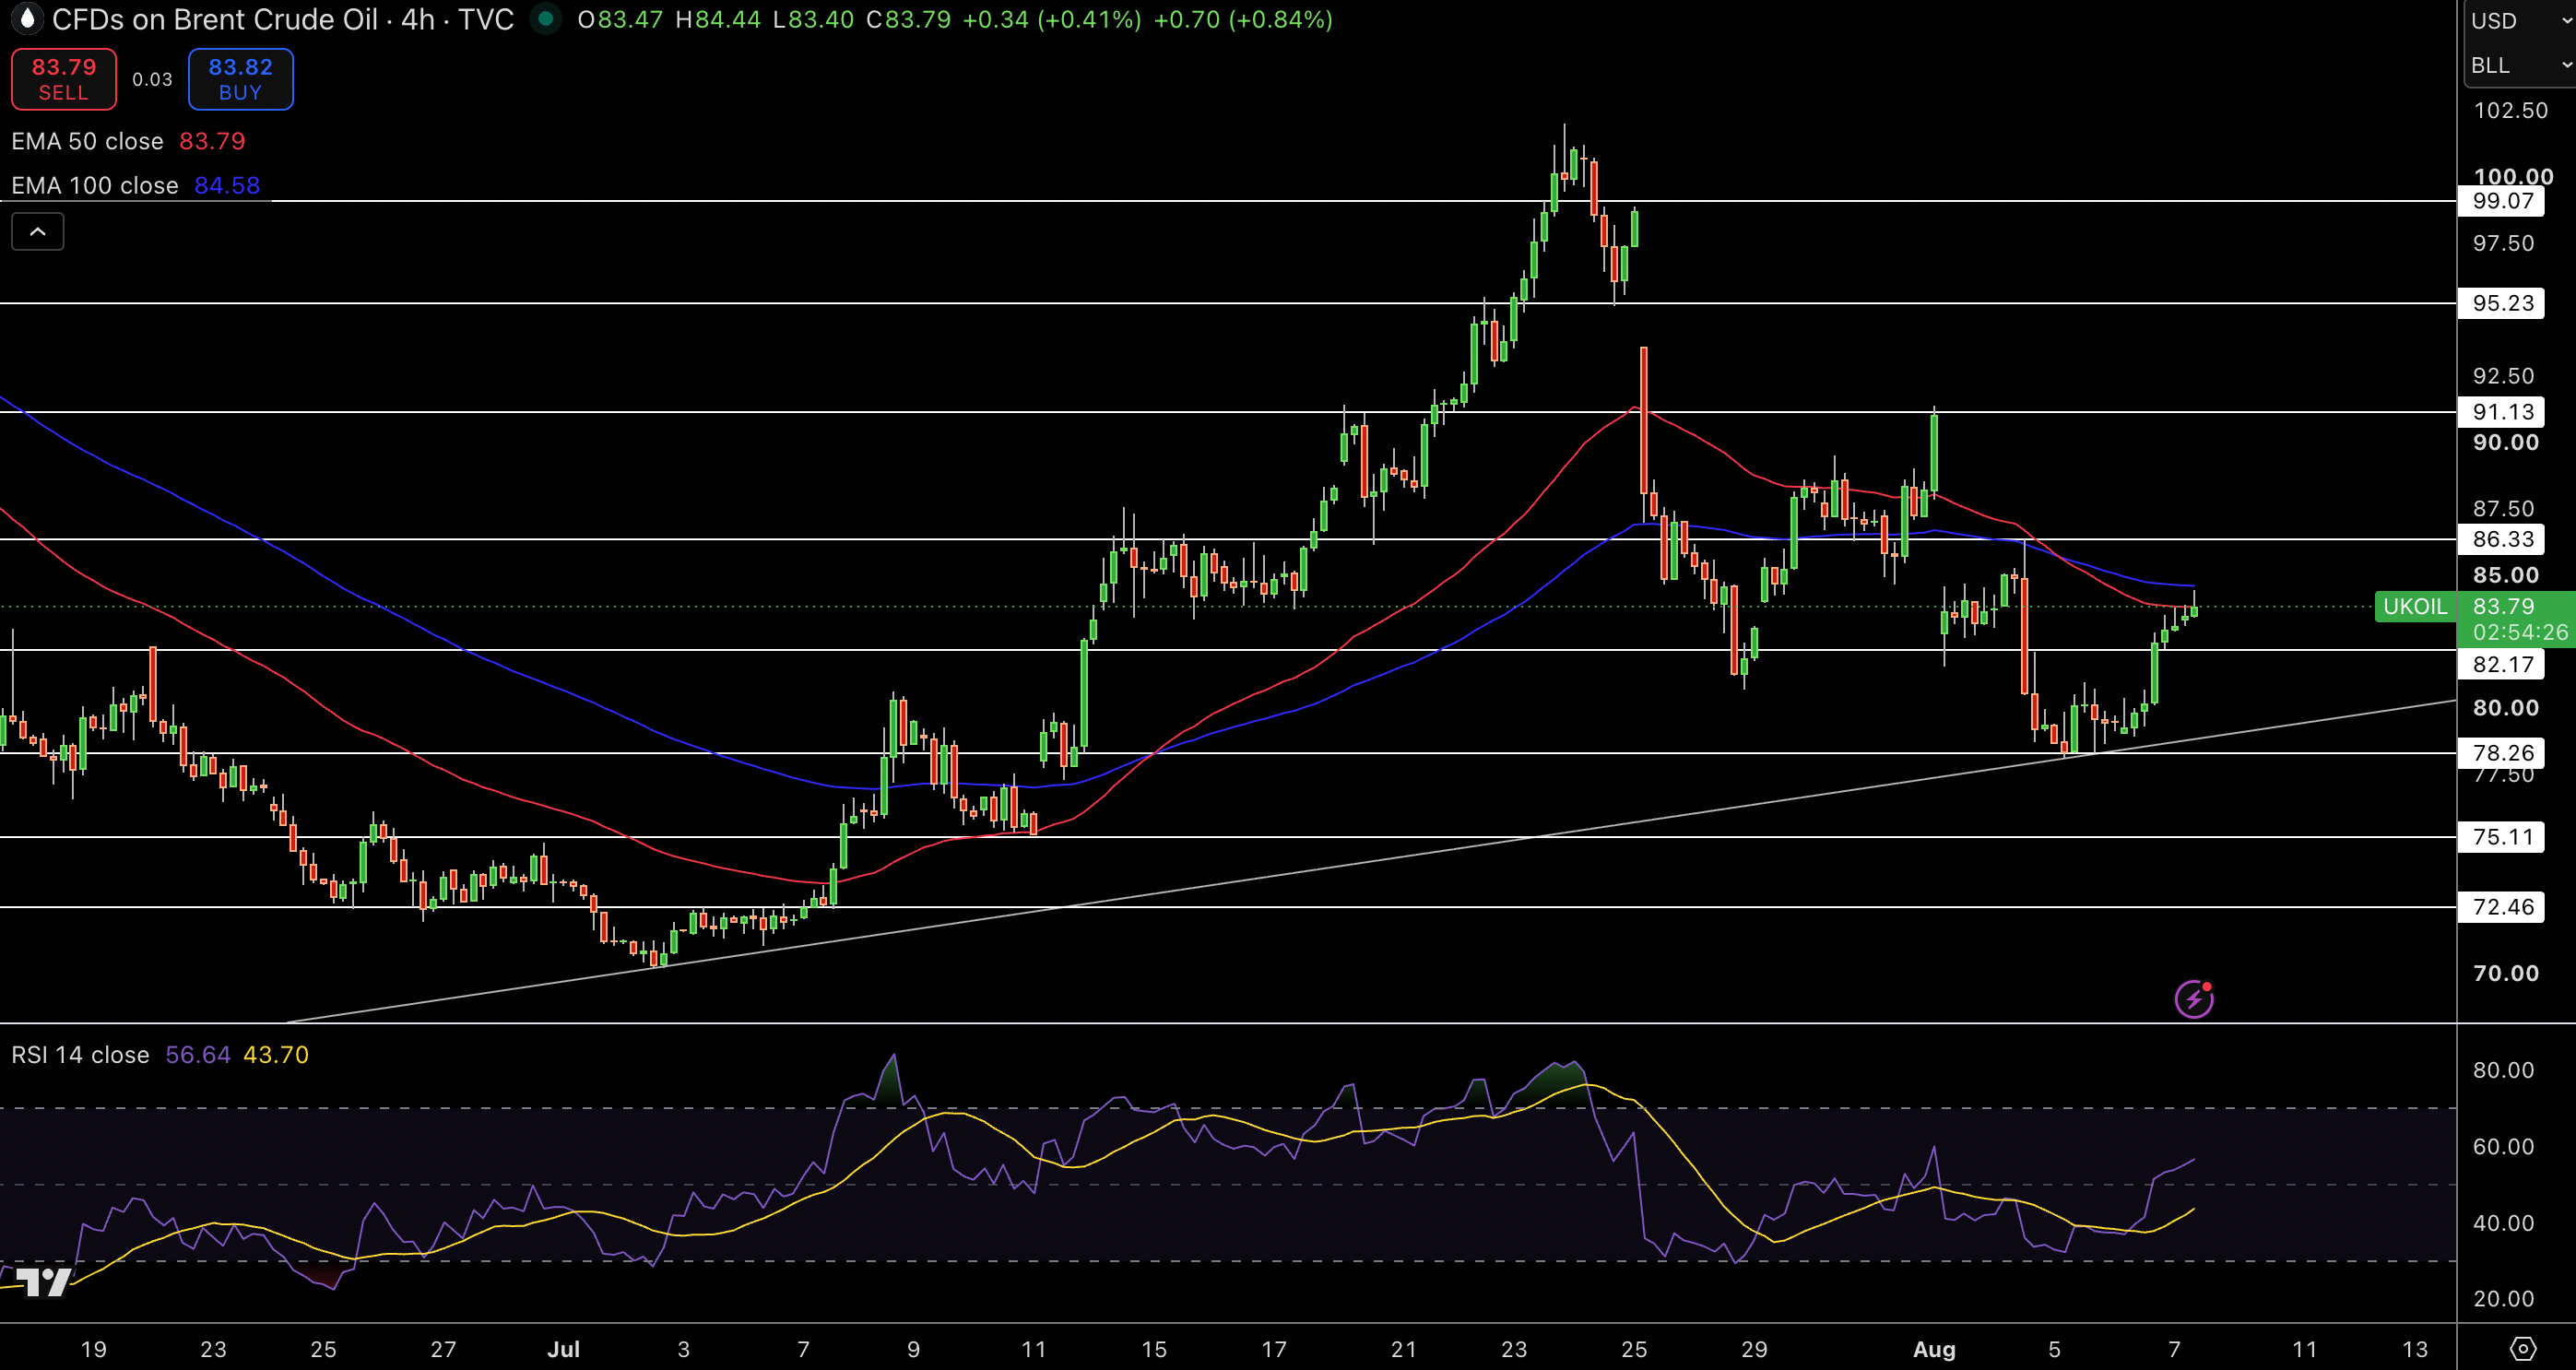
Brent crude is trading at around $83.89 as it continues to make its recovery after bouncing off the rising trendline at $78.30. Prices have been trading above the 50-period EMA ($83.80), but are still trading below the 100-period EMA ($84.59). RSI has moved to 57, signaling the push is moving bullish and is the first sign of a bullish trend.
A move above $84.60 will continue the push to resistance at $86.33, $91.13, and $95.23. The first support is at $82.17, followed by the trendline at $78.26. As long as Brent crude holds above the 50-EMA, there is a stronger bullish case for an eventual push to the 100-EMA.



