Failed Breakout Signals Caution
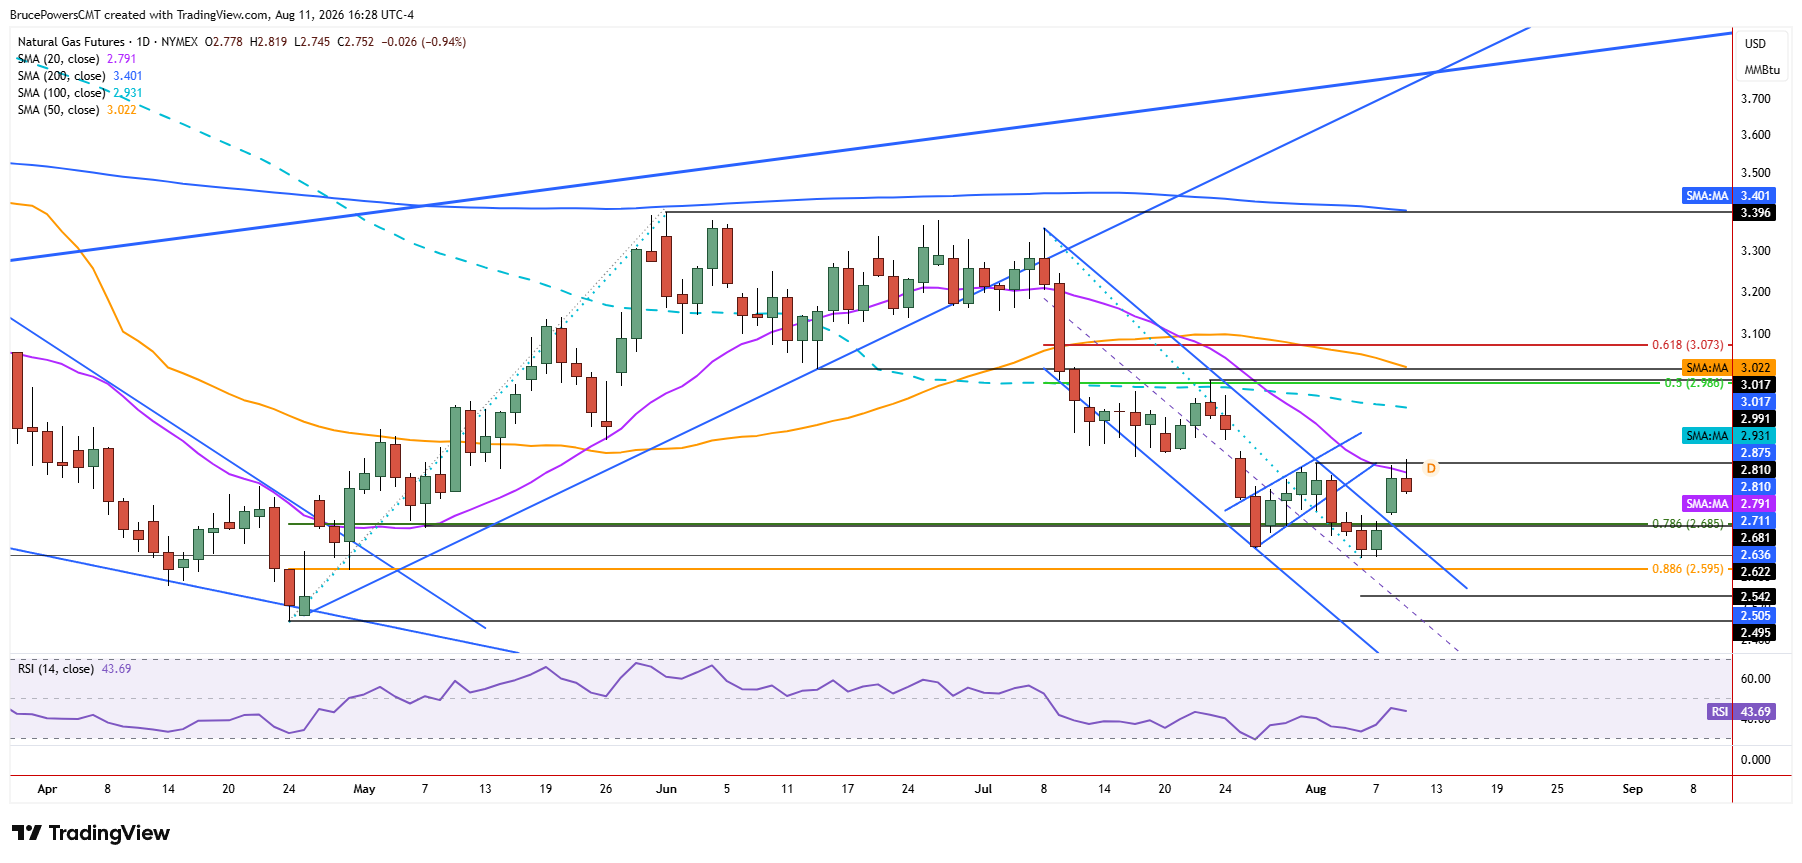
Although natural gas reached a slightly new high of $2.82 during Tuesday’s session, persistent resistance near the 20-day moving average halted further advances. The higher daily high provided a trend reversal signal above the recent lower swing high of $2.81, but the breakout needs a daily close above that level to confirm, and that did not happen. Instead, sellers took back control following the daily high and drove price lower.
At the time of writing, trading continues in the lower half of the day’s range, a sign of weakening. Therefore, Tuesday’s price action currently represents a failed attempt to reverse the short-term bearish trend rather than a confirmed bullish signal.

$2.81 Becomes Key Dividing Line
A daily close below both the swing high at $2.81 and the 20-day moving average, now at $2.79, would confirm resistance and show the continued retention of downward pressure. That price zone now marks a key resistance zone. Staying below it is bearish, since the 20-day moving average was confirmed as dynamic resistance. Initial lower potential support levels include Monday’s higher daily low of $2.70 and Friday’s high of $2.69. A break below those levels would weaken the recent stabilization and increase the likelihood of a move toward lower support. Conversely, reclaiming $2.81 would give buyers another opportunity to challenge the short-term downtrend.
Short-Term Trend Shows Signs of Softening
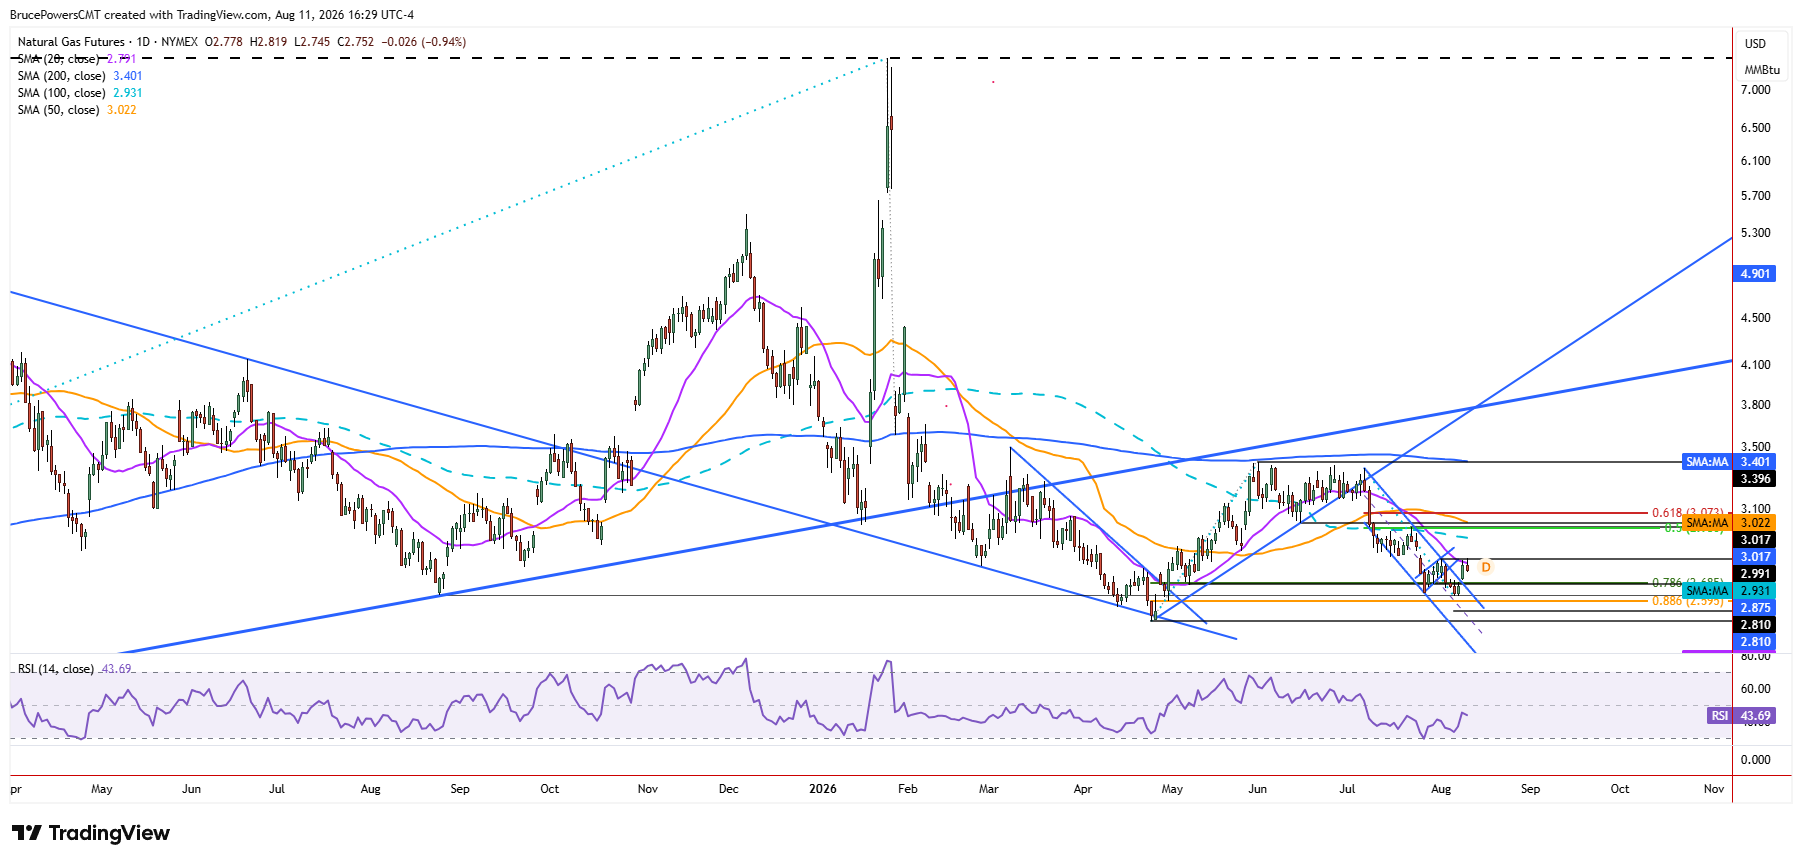
Since the downtrend line was broken to the upside on Monday, the angle of descent for the short-term bearish trend that triggered five weeks ago may be softening. This could mean that a decisive bullish reversal above $2.81 may lead to higher targets while still retaining the larger downtrend structure.
$2.93 Offers Next Major Test
An initial upside target is defined by the 100-day moving average near $2.93, since it was successfully tested as resistance during the formation of a tight nine-day consolidation range. That range followed a break below the 100-day moving average on July 10, and it included the first pullback to test it as resistance. As typically happens, that pullback resulted in a bearish continuation. A recovery back toward $2.93 would therefore provide an important test of whether the recent improvement in short-term momentum can develop into something more substantial.
If the 100-day moving average can be reclaimed, the lower swing high of $2.99 becomes an upside target, with the chance that it is exceeded to the upside. For now, however, $2.81 remains the key dividing line. Failure to reclaim it would reinforce the resistance established near the 20-day moving average and keep the bearish trend in control, while a confirmed breakout would reopen the path toward $2.93 and possibly $2.99.
Natural Gas Price Forecast
Every new Natural Gas analysis as it publishes, today's technical signal and key levels, live price — on one page.
See all Natural Gas forecastsIf you’d like to know more about how to trade natural gas, please visit our educational area.