Pressure Builds Beneath Key Resistance
Pressure looks to be building for natural gas to successfully reclaim its 20-day moving average and trigger a bullish reversal signal. It has been pressing up against resistance near the recent lower swing high of $2.81 and the 20-day moving average near $2.79 for several days, including Wednesday. Also, a long-term downtrend line converges in the same price zone. So far, there has not been a daily close above either level but that could change if Wednesday’s session closes above the 20-day moving average or above $2.81. A close above either level would provide an initial indication that upside momentum is strengthening.
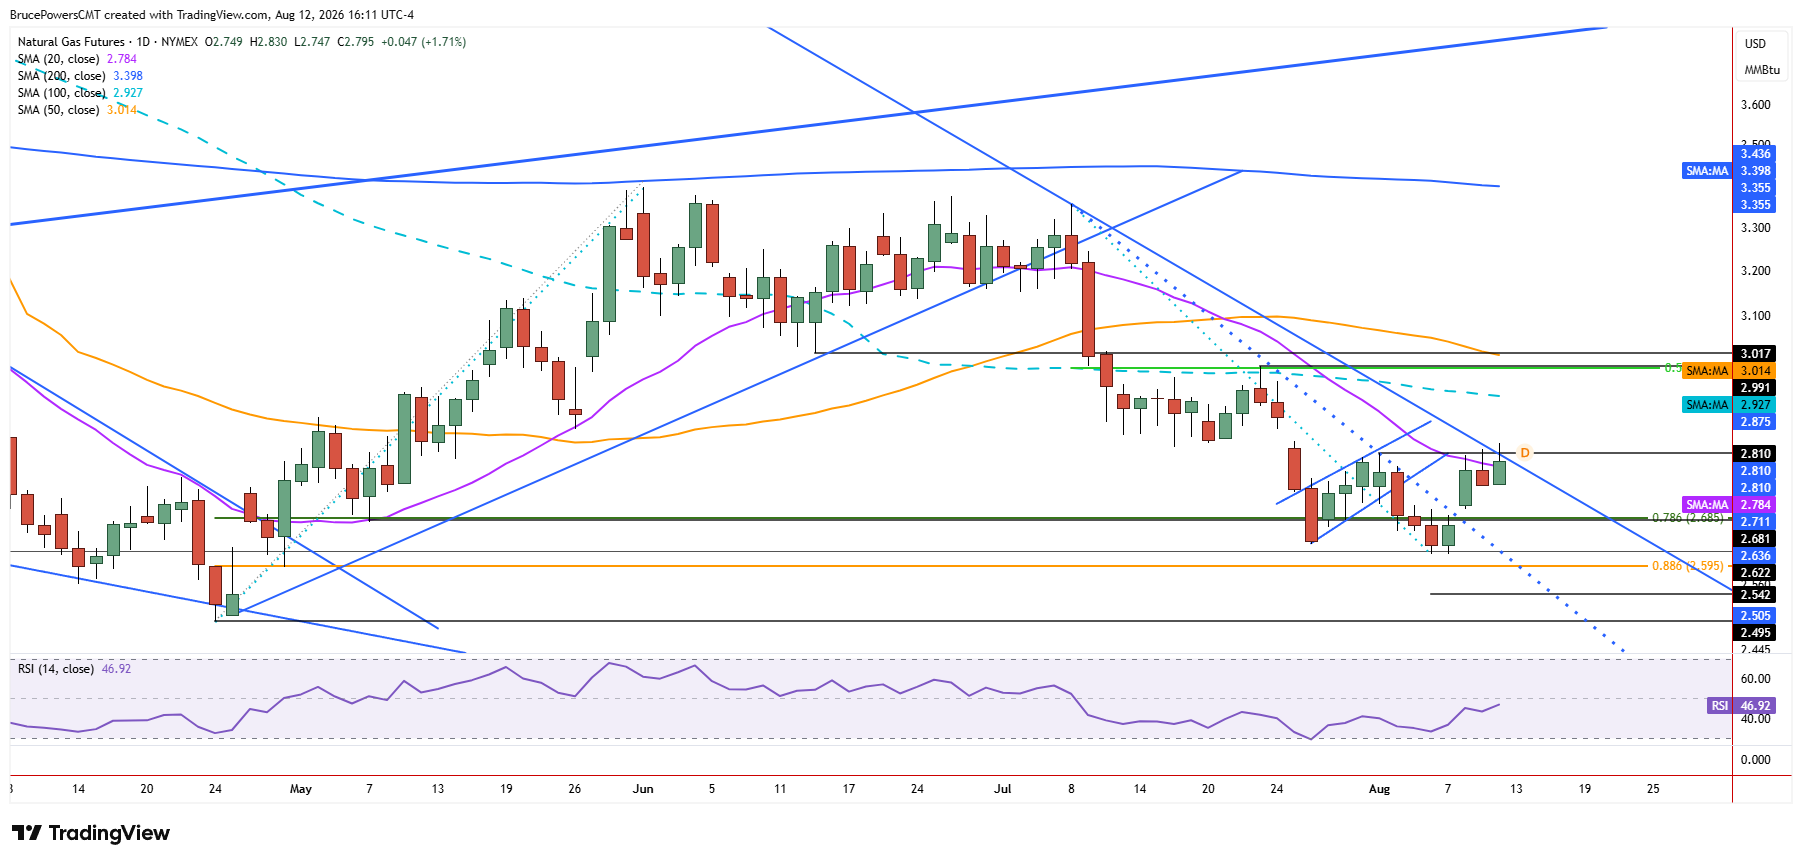
A slightly higher daily high of $2.83 was reached on Wednesday before the subsequent pullback. This move above the recent lower swing high at $2.81 provides an early bullish reversal signal, but confirmation is needed with a daily close above the lower swing high. A sustained move above Wednesday’s high would provide additional evidence that buyers are gaining control and that the recent bottom may be holding.

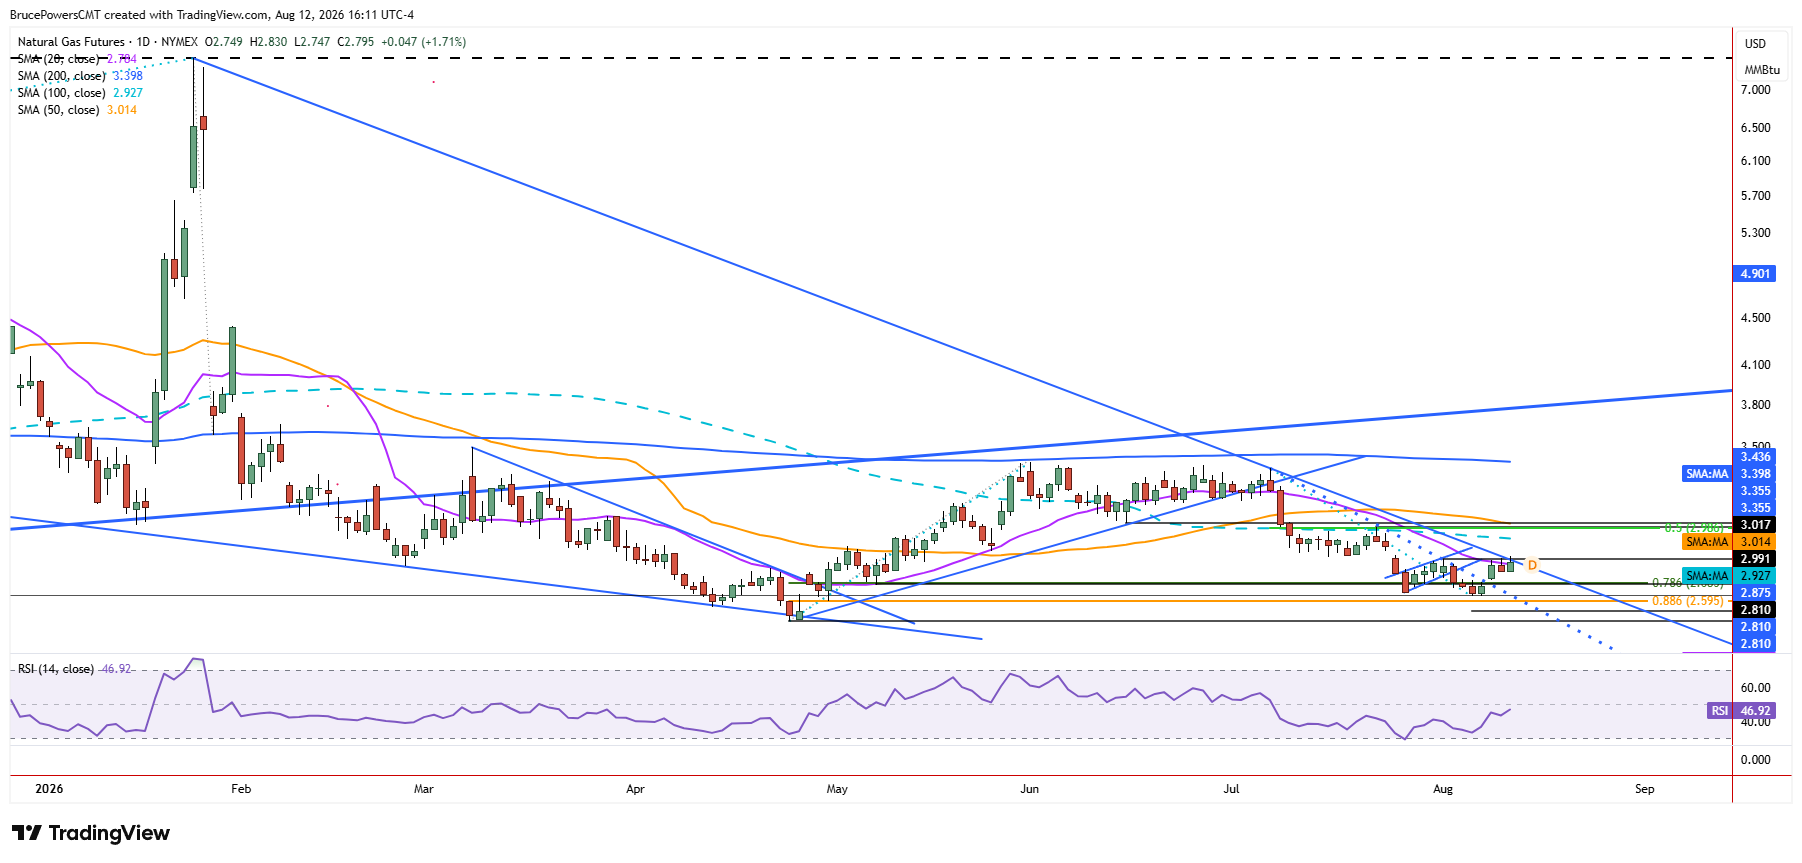
Fibonacci Reset Strengthens Rebound
Natural gas recently reached an extreme Fibonacci retracement zone, essentially completing an 88.6% retracement of the prior advance before a recovery became possible. Following a sharp bullish reversal on Monday, the first test of resistance near the lower swing high at $2.81 occurred. Since subsequent pullbacks were mild and a new high was reached on Wednesday, the resilience of the rebound suggests that another wave of buying could push through $2.81 and Wednesday’s high of $2.83, potentially opening the door to higher targets.
Downside Risk Remains Below $2.74
Nonetheless, a drop below Wednesday’s low of $2.74 could lead to a deeper pullback to test support near Monday’s low of $2.70 or Friday’s high of $2.69. That would also keep the downtrend structure intact and maintain downward pressure. Conversely, given the completion of the extreme Fibonacci retracement, the sharp advance off the bottom, and continued upside pressure, another leg higher remains possible unless the recent low is broken to the downside.
$2.99 Target Comes Into Focus
If a decisive breakout above Wednesday’s high is sustained, the first upside target from the current price structure is at the lower swing high of $2.99. It is further supported by the 50% retracement of the prior decline, which is at $2.98. However, on the way there, resistance could emerge near the 100-day moving average near $2.92, since it was previously confirmed as resistance during the prior short-term advance. Therefore, the ability to reclaim the 20-day moving average and sustain a move above $2.81 remains the key near-term test. A successful breakout would strengthen the case for a move toward $2.92 and eventually the $2.98-$2.99 target zone.
If you’d like to know more about how to trade natural gas, please visit our educational area.