A Reversal Takes Shape
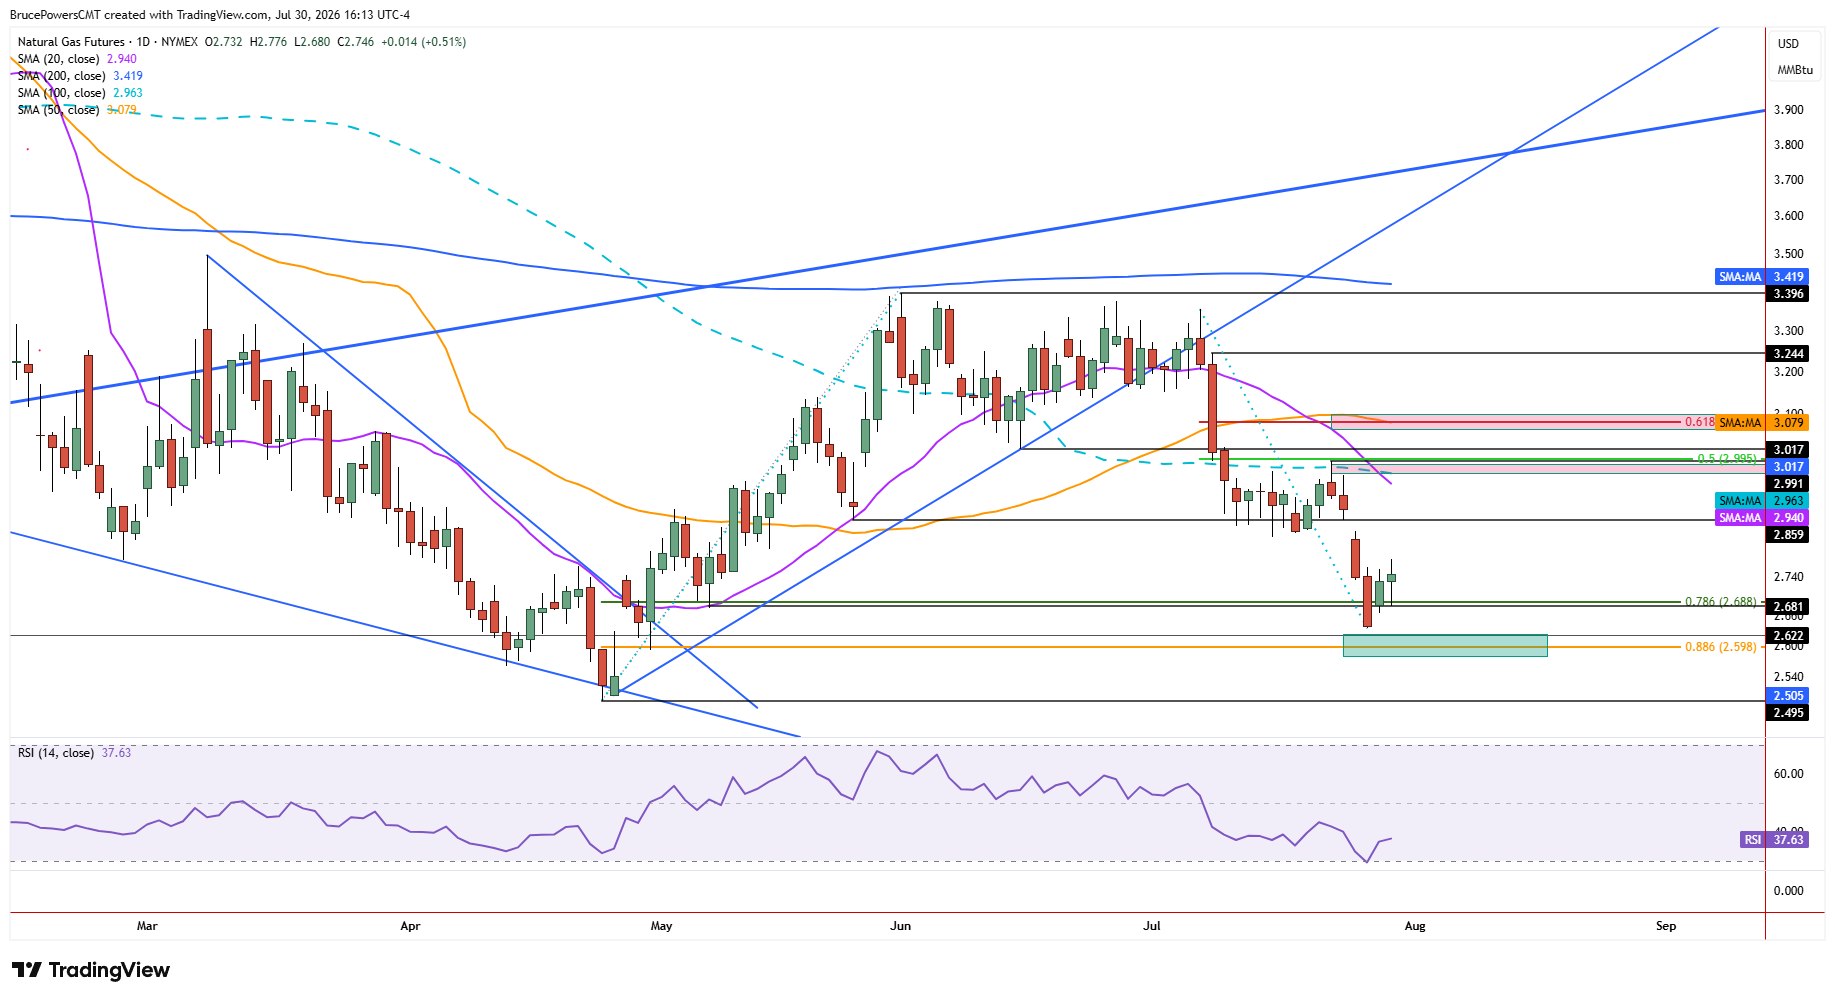
Natural gas triggered a reversal signal off the daily chart on Thursday, with a rally to a three-day high of $2.78 creating a new higher daily high and higher low. A daily close above Tuesday’s high of $2.76 will confirm the upside breakout. This represents bullish follow-through after a corrective low of $2.64 was reached and confirmed on Tuesday with a close near session lows. That was quickly followed by short-term strength on Wednesday. The price action reflects the bullish response to the failed breakdown and supports the potential for trend continuation.

Resistance Awaits Above $2.86
If strength continues, the first upside target is the higher swing low at $2.86. That begins a range of possible resistance extending up to the recent lower swing high of $2.99. There are several indicators confirming that area as resistance, so a sustained breakout above it could be significant. Otherwise, resistance is expected to be seen before the $2.99 high, which could be followed by weakness. This makes the $2.86-$2.99 zone an important test of whether the recent reversal can develop into a more sustained advance.
Moving Averages Define the Next Test
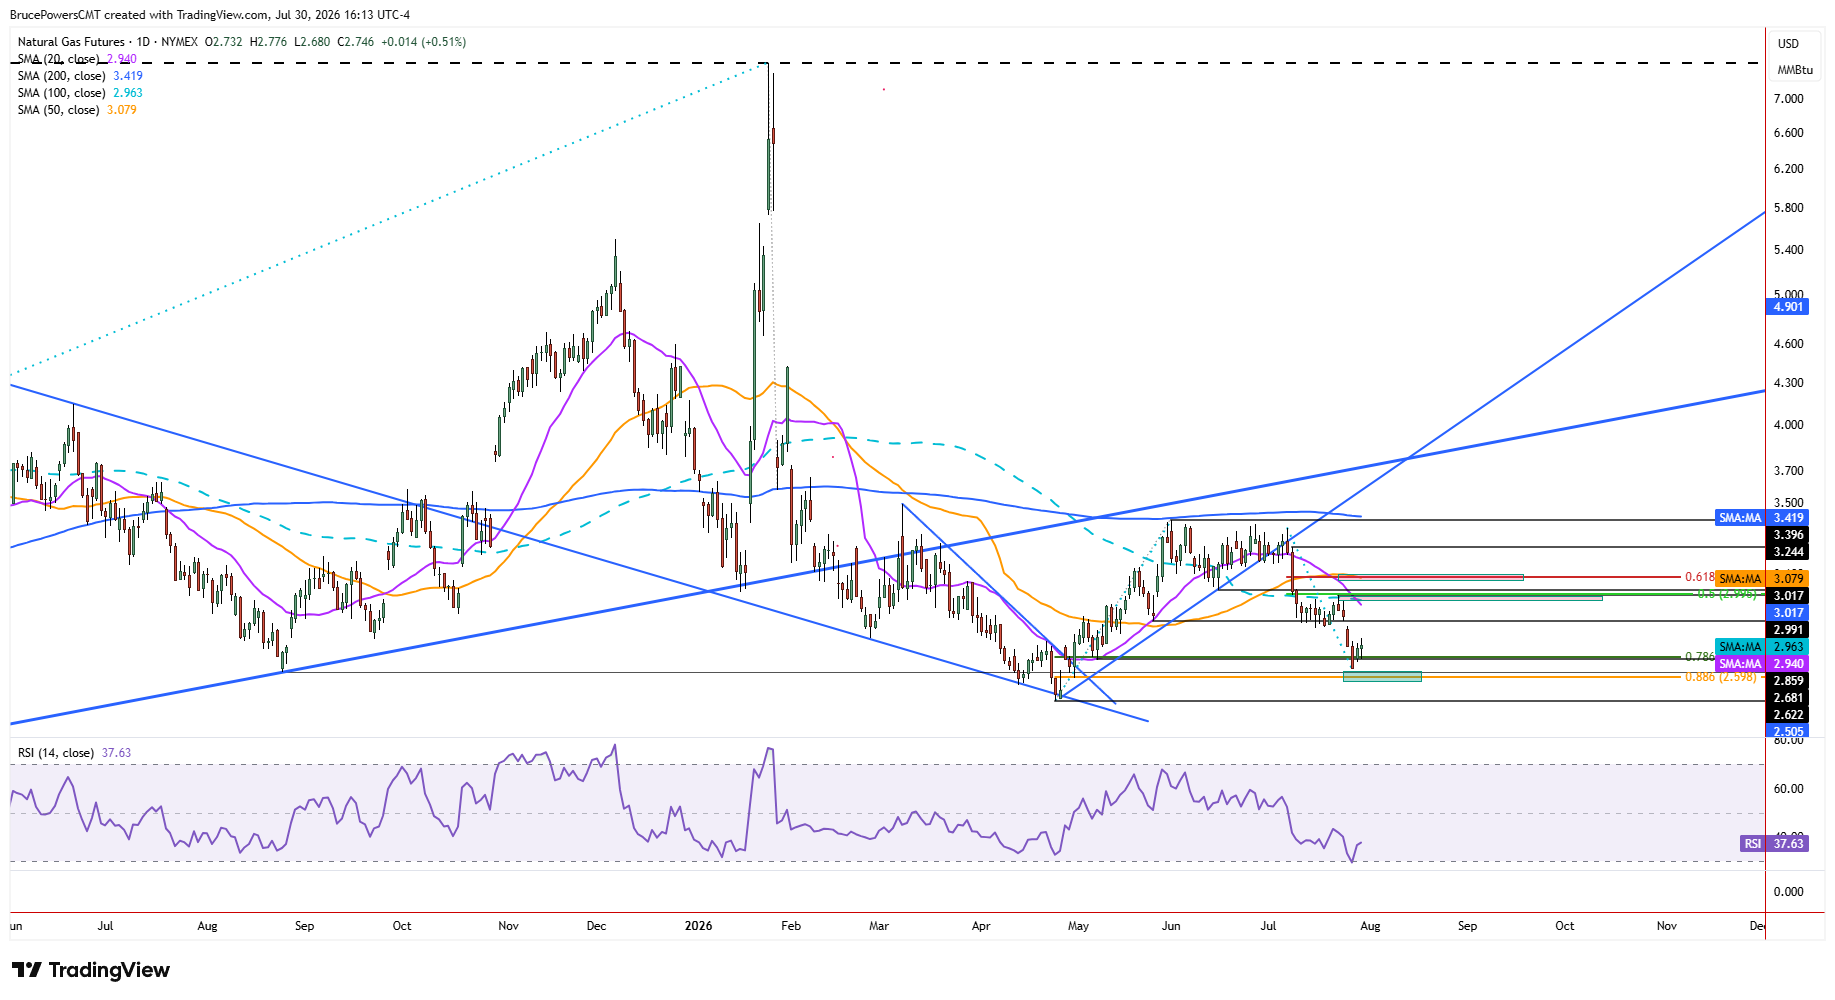
The 20-day moving average is at $2.94 and falling, and it represents initial dynamic resistance. If that indicator can be reclaimed, there is a chance for higher targets to be reached. The 100-day moving average near $2.96 is currently close to the lower swing high and represents the more significant dynamic resistance indicator, especially since it was previously confirmed as resistance near the $2.99 swing high. Downward pressure in natural gas is likely to continue unless that average can be reclaimed. Therefore, the moving-average zone near $2.94-$2.96 could determine whether the current rebound has enough strength to challenge the $2.99 resistance level.
Support Holds the Bullish Case Together
Key short-term support is Thursday’s low of $2.68, followed by $2.67 from Wednesday. The next lower target is near the 88.6% Fibonacci retracement at $2.60. If that area fails as support, the April trend low near $2.50 becomes a target and, given the larger bearish trend structure, appears likely to eventually be broken, opening the way to lower price levels. For now, however, the $2.68-$2.67 support zone is the first test of whether Thursday’s reversal can hold, while a close above $2.76 would strengthen the bullish case.
If you’d like to know more about how to trade natural gas, please visit our educational area.