


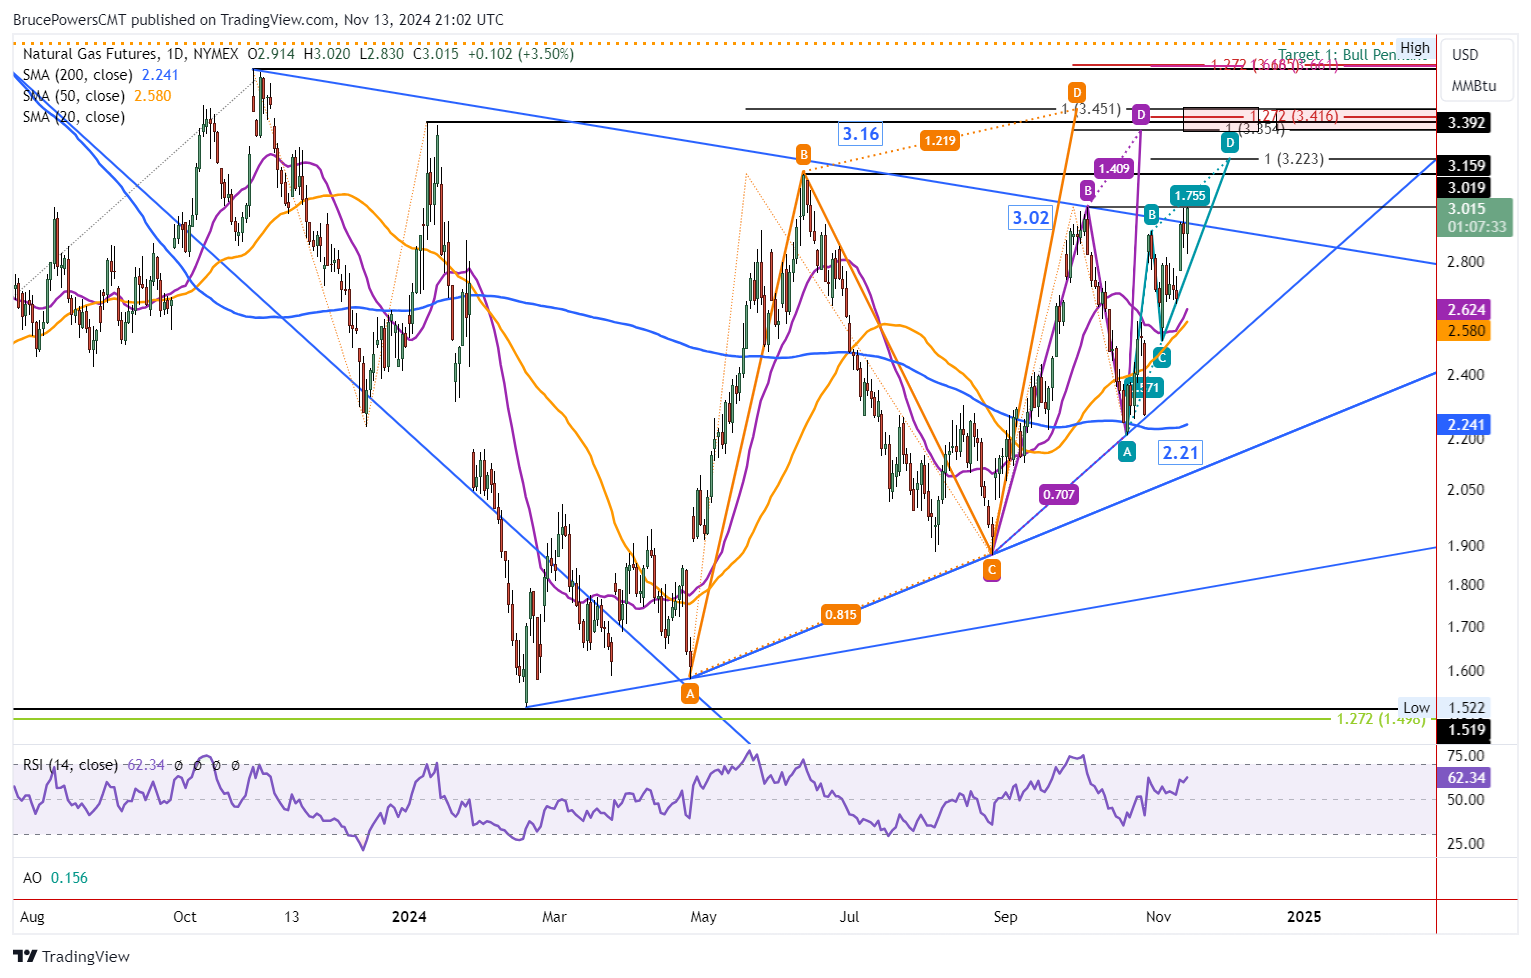
Following a dip earlier in Wednesday’s trading session natural gas subsequently rallied off support of 2.83, the low for the day. For the second day in a row, it broke out above the top trendline of a large symmetrical triangle pattern. A breakout was attempted yesterday with a new high of 3.01 but it was quickly met with resistance that led to a down day and a close below the trendline.
Natural Gas Price Forecast
Every new Natural Gas analysis as it publishes, today's technical signal and key levels, live price — on one page.
See all Natural Gas forecastsIn other words, it closed weak and showed signs of a failed breakout. A second attempt today shows that buyers remain in control. At the time of this writing natural gas continues to trade near the highs of the day and above the trendline. A close today above the line will show strength. Moreover, a daily close above 3.00 will be the highest closing price since June 13.

Rally Above 3.02 Triggers Bull Breakout
Resistance was seen on Tuesday following the day’s high of 3.01. That was a failed attempt to break out above the most recent swing high of 3.02. A decisive rally above that high should provide a more reliable indicator for the triangle breakout. It will also signal a continuation of the rising trend that began from the August swing low as a higher swing high will be triggered.
The 3.02 high is also a monthly high for October. Therefore, a rise above it will also trigger a monthly upside breakout and result in a third month in a row of higher monthly highs and higher lows. Nonetheless, if natural gas can end the month above September’s closing price of 2.91 it will have reached its highest monthly closing price since October 2023.
Initial Upside Target at 3.22
Given the bullish recovery today following a pullback, it looks like natural gas may have completed a short correction and could attempt to advance above 3.02 shortly. If it can sustain a rally above that high, it next heads towards the 3.16 swing high from June. Then, a little higher, is an initial target from a small rising ABCD pattern (light blue) at 3.22. However, there is a confluence of price targets from 3.35 and 3.45, including the initial target from a rising ABCD pattern at 3.35 (purple) and a larger ABCD pattern marked in orange that targets 3.45.
For a look at all of today’s economic events, check out our economic calendar.


