Bullish Momentum Faces Next Test
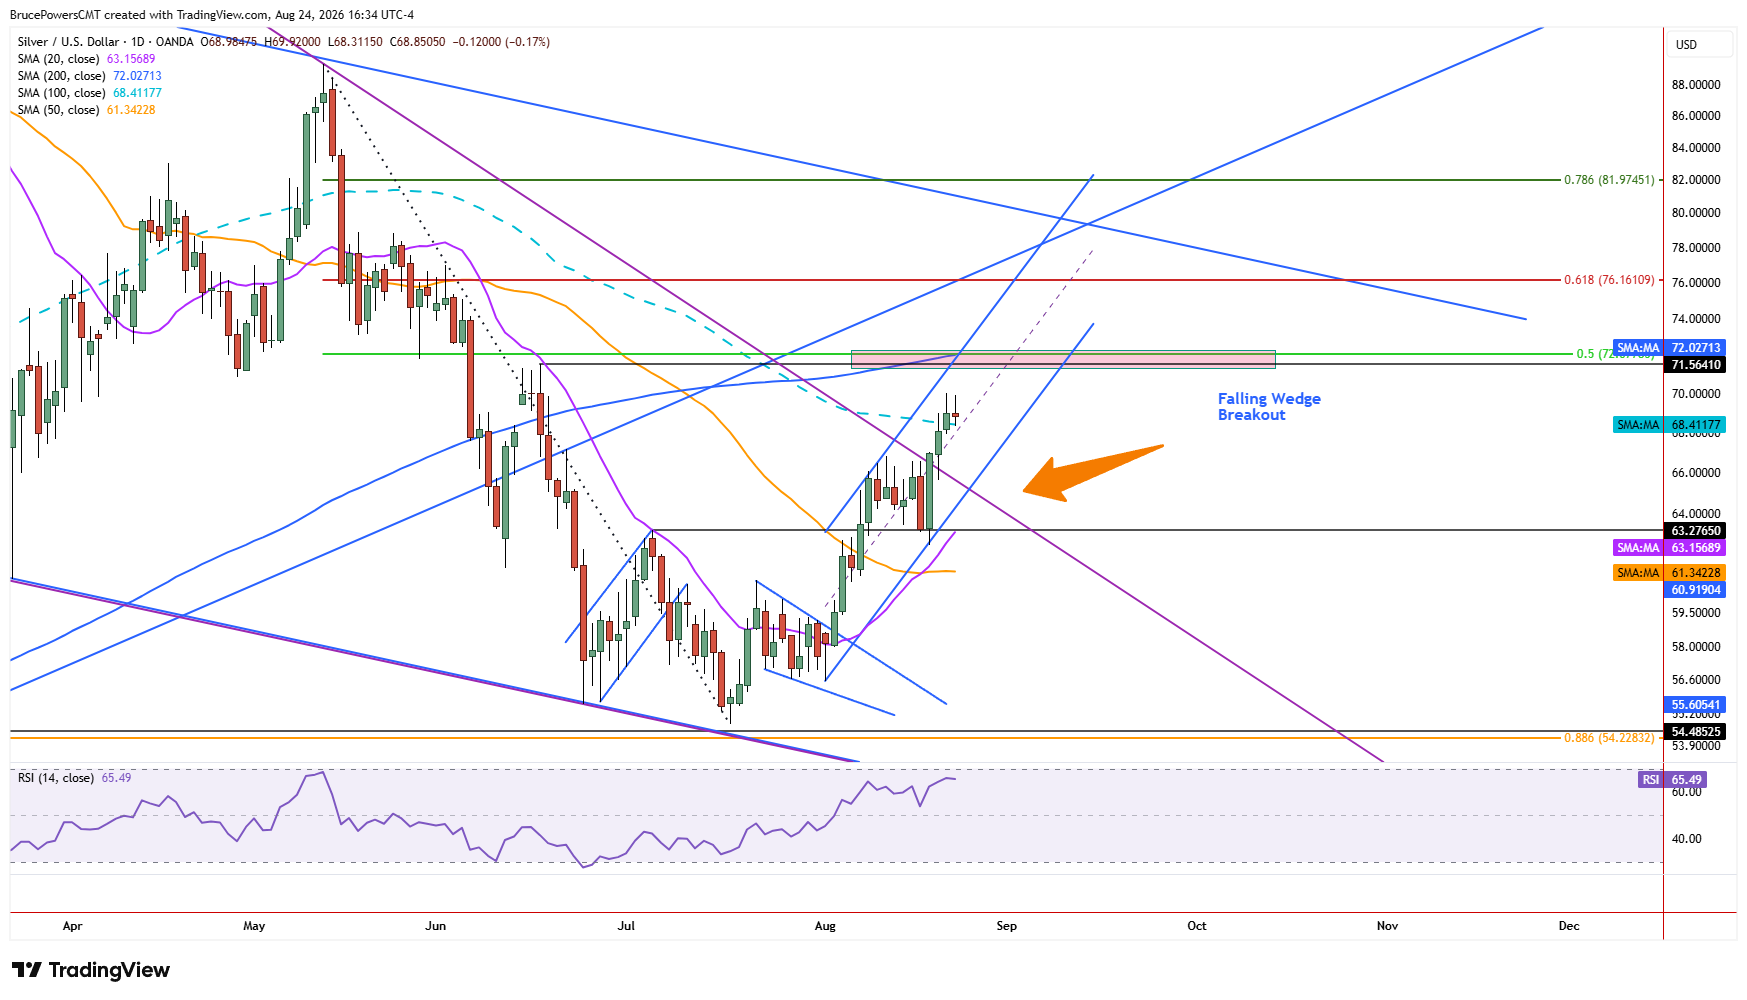
Silver struggled to hold above the 100-day moving average for a second day on Monday, after closing above it on Friday. This resulted in a likely inside day, reflecting consolidation around the potential support indicated by that average. The bullish trend remains intact and a breakout above Monday’s high of $69.92, followed by an advance above the current trend high of $70.02, would put silver on track to test resistance around the 200-day moving average, currently near $72.03.
That potential advance would also provide the next test of whether the recent improvement in momentum can overcome long-term resistance that has constrained price since June.

Resistance Converges Near $72
A potential resistance zone near the 200-day moving average is supported by the lower swing high of $71.56 from June and the 50% retracement of the prior downtrend at $72.08. This confluence of indicators strengthens the importance of the area, particularly because the current upswing would represent the first test of the 200-day moving average as resistance since it failed as support in June. A similar dynamic is developing at the long-term uptrend line, which was also lost as support and has since become a potential resistance indicator. Given these converging technical levels, silver has a good chance of reaching the 200-day moving average before the next significant decision point emerges.
Falling Wedge Signals Upside Potential
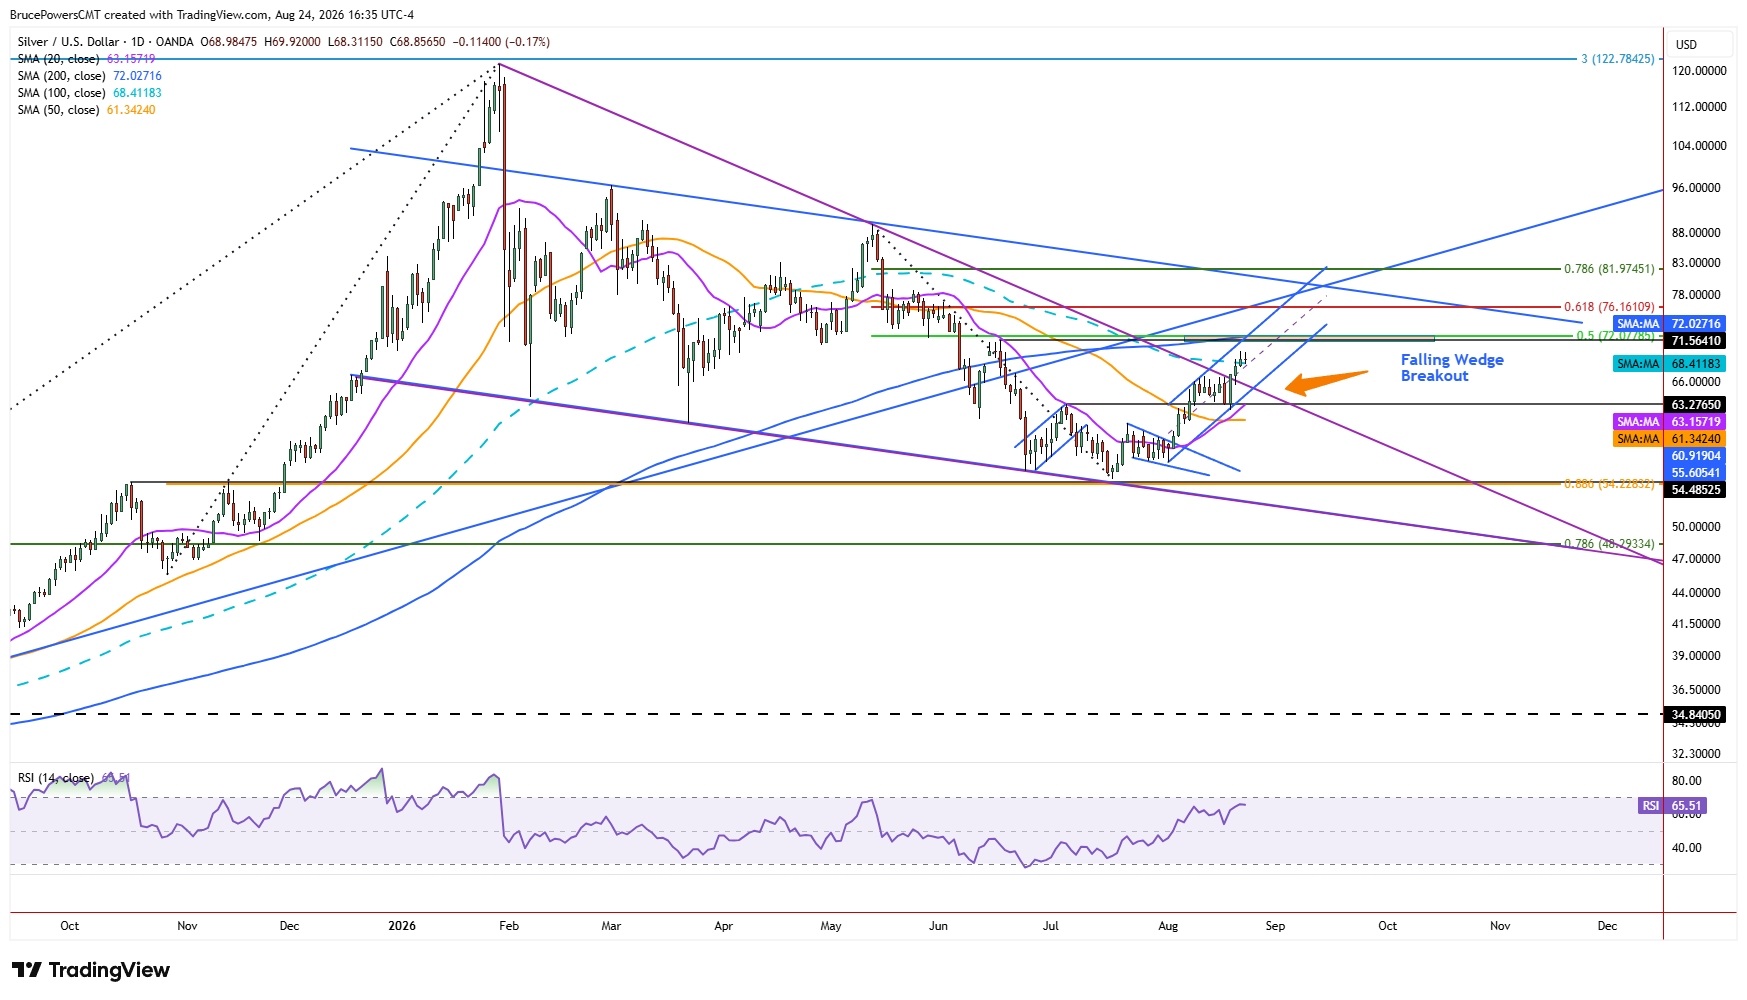
At the same time, the developing short-term bullish structure provides reason to watch for continued upside progress. Silver’s break above a downtrend line last week triggered a breakout from a falling wedge pattern (purple), a bullish reversal formation. An initial target derived from the pattern is at the beginning of the formation, near the record high of $121.67 reached at the end of January. Before that longer-term target comes into focus, however, silver could first extend above that next resistance zone toward the 61.8% Fibonacci retracement of the recent downswing at $76.6.
Silver could reach that potential upside target zone while continuing to trade below the uptrend line, thereby maintaining it as a resistance indicator. Therefore, the approaching 200-day moving average and long-term uptrend line are likely to provide the next key test, determining whether the current bullish momentum develops into a more significant reversal or remains part of a broader corrective structure.
If you’d like to know more about how to trade gold and silver, please visit our educational area.